Capital One 2014 Annual Report Download - page 234
Download and view the complete annual report
Please find page 234 of the 2014 Capital One annual report below. You can navigate through the pages in the report by either clicking on the pages listed below, or by using the keyword search tool below to find specific information within the annual report.-
 1
1 -
2
-
3
-
4
-
5
-
6
-
7
-
8
-
9
-
10
-
11
-
12
-
13
-
14
-
15
-
16
-
17
-
18
-
19
-
20
-
21
-
22
-
23
-
24
-
25
-
26
-
27
-
28
-
29
-
30
-
31
-
32
-
33
-
34
-
35
-
36
-
37
-
38
-
39
-
40
-
41
-
42
-
43
-
44
-
45
-
46
-
47
-
48
-
49
-
50
-
51
-
52
-
53
-
54
-
55
-
56
-
57
-
58
-
59
-
60
-
61
-
62
-
63
-
64
-
65
-
66
-
67
-
68
-
69
-
70
-
71
-
72
-
73
-
74
-
75
-
76
-
77
-
78
-
79
-
80
-
81
-
82
-
83
-
84
-
85
-
86
-
87
-
88
-
89
-
90
-
91
-
92
-
93
-
94
-
95
-
96
-
97
-
98
-
99
-
100
-
101
-
102
-
103
-
104
-
105
-
106
-
107
-
108
-
109
-
110
-
111
-
112
-
113
-
114
-
115
-
116
-
117
-
118
-
119
-
120
-
121
-
122
-
123
-
124
-
125
-
126
-
127
-
128
-
129
-
130
-
131
-
132
-
133
-
134
-
135
-
136
-
137
-
138
-
139
-
140
-
141
-
142
-
143
-
144
-
145
-
146
-
147
-
148
-
149
-
150
-
151
-
152
-
153
-
154
-
155
-
156
-
157
-
158
-
159
-
160
-
161
-
162
-
163
-
164
-
165
-
166
-
167
-
168
-
169
-
170
-
171
-
172
-
173
-
174
-
175
-
176
-
177
-
178
-
179
-
180
-
181
-
182
-
183
-
184
-
185
-
186
-
187
-
188
-
189
-
190
-
191
-
192
-
193
-
194
-
195
-
196
-
197
-
198
-
199
-
200
-
201
-
202
-
203
-
204
-
205
-
206
-
207
-
208
-
209
-
210
-
211
-
212
-
213
-
214
-
215
-
216
-
217
-
218
-
219
-
220
-
221
-
222
-
223
-
 224
224 -
 225
225 -
 226
226 -
 227
227 -
 228
228 -
 229
229 -
 230
230 -
 231
231 -
 232
232 -
 233
233 -
 234
234 -
 235
235 -
 236
236 -
 237
237 -
 238
238 -
 239
239 -
 240
240 -
 241
241 -
 242
242 -
 243
243 -
 244
244 -
245
-
246
-
247
-
248
-
249
-
250
-
251
-
252
-
253
-
254
-
255
-
256
-
257
-
258
-
259
-
260
-
261
-
262
-
263
-
264
-
265
-
266
-
267
-
268
-
269
-
270
-
271
-
272
-
273
-
274
-
275
-
276
-
277
-
278
-
279
-
280
-
281
-
282
-
283
-
284
-
285
-
286
-
287
-
288
-
289
-
290
-
291
-
292
-
293
-
294
-
295
-
296
-
297
-
298
-
299
-
300
 |
 |

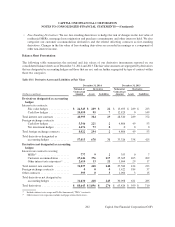
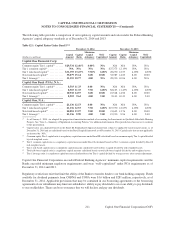
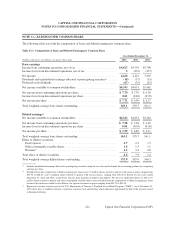
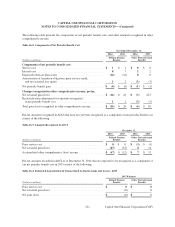
NOTE 13—EARNINGS PER COMMON SHARE
The following table sets forth the computation of basic and diluted earnings per common share:
Table 13.1: Computation of Basic and Diluted Earnings per Common Share
Year Ended December 31,
(Dollars and shares in millions, except per share data) 2014 2013 2012
Basic earnings
Income from continuing operations, net of tax . . . . . . . . . . . . . . . . . . . . . . . . . . . . $4,423 $4,354 $3,709
Income (loss) from discontinued operations, net of tax . . . . . . . . . . . . . . . . . . . . . 5(233) (217)
Net income . . . . . . . . . . . . . . . . . . . . . . . . . . . . . . . . . . . . . . . . . . . . . . . . . . . . . . . . 4,428 4,121 3,492
Dividends and undistributed earnings allocated to participating securities(1) . . . . . (18) (17) (15)
Preferred stock dividends . . . . . . . . . . . . . . . . . . . . . . . . . . . . . . . . . . . . . . . . . . . . (67) (53) (15)
Net income available to common stockholders . . . . . . . . . . . . . . . . . . . . . . . . . . . . $4,343 $4,051 $3,462
Net income from continuing operations per share . . . . . . . . . . . . . . . . . . . . . . . . . . $ 7.70 $ 7.39 $ 6.56
Income (loss) from discontinued operations per share . . . . . . . . . . . . . . . . . . . . . . 0.01 (0.40) (0.39)
Net income per share . . . . . . . . . . . . . . . . . . . . . . . . . . . . . . . . . . . . . . . . . . . . . . . . $ 7.71 $ 6.99 $ 6.17
Total weighted-average basic shares outstanding . . . . . . . . . . . . . . . . . . . . . . . . . . 563.1 579.7 561.1
Diluted earnings(2)
Net income available to common stockholders . . . . . . . . . . . . . . . . . . . . . . . . . . . . $4,343 $4,051 $3,462
Net income from continuing operations per share . . . . . . . . . . . . . . . . . . . . . . . . . . $ 7.58 $ 7.28 $ 6.49
Income (loss) from discontinued operations per share . . . . . . . . . . . . . . . . . . . . . . 0.01 (0.39) (0.38)
Net income per share . . . . . . . . . . . . . . . . . . . . . . . . . . . . . . . . . . . . . . . . . . . . . . . . $ 7.59 $ 6.89 $ 6.11
Total weighted-average basic shares outstanding . . . . . . . . . . . . . . . . . . . . . . . . . . 563.1 579.7 561.1
Effect of dilutive securities:
Stock options . . . . . . . . . . . . . . . . . . . . . . . . . . . . . . . . . . . . . . . . . . . . . . . . . . . . 2.7 2.2 1.5
Other contingently issuable shares . . . . . . . . . . . . . . . . . . . . . . . . . . . . . . . . . . . 1.6 1.5 1.1
Warrants(3) . . . . . . . . . . . . . . . . . . . . . . . . . . . . . . . . . . . . . . . . . . . . . . . . . . . . . . . 4.5 4.2 2.8
Total effect of dilutive securities . . . . . . . . . . . . . . . . . . . . . . . . . . . . . . . . . . . . . . . 8.8 7.9 5.4
Total weighted-average diluted shares outstanding . . . . . . . . . . . . . . . . . . . . . . . . . 571.9 587.6 566.5
(1) Includes undistributed earnings allocated to participating securities using the two-class method under the accounting guidance for computing
earnings per share.
(2) Excluded from the computation of diluted earnings per share were 2.9 million shares related to options with exercise prices ranging from
$70.96 to $88.81, and 5.2 million shares related to options with exercise prices ranging from $56.28 to $88.81 for the years ended
December 31, 2014 and 2013, respectively, because their inclusion would be anti-dilutive. For the year ended December 31, 2012, 6.9
million shares related to options and other contingently issuable shares were excluded from the computation of diluted earnings per share
because their inclusion would be anti-dilutive; the options had exercise prices ranging from $45.75 to $89.10.
(3) Represents warrants issued as part of the U.S. Department of Treasury’s Troubled Assets Relief Program (“TARP”). As of December 31,
2014, there were 6.4 million warrants to purchase common stock outstanding, which represents approximately half of the warrants issued
in the initial offering.
212
CAPITAL ONE FINANCIAL CORPORATION
NOTES TO CONSOLIDATED FINANCIAL STATEMENTS—(Continued)
Capital One Financial Corporation (COF)