Capital One 2014 Annual Report Download - page 297
Download and view the complete annual report
Please find page 297 of the 2014 Capital One annual report below. You can navigate through the pages in the report by either clicking on the pages listed below, or by using the keyword search tool below to find specific information within the annual report.-
 1
1 -
2
-
3
-
4
-
5
-
6
-
7
-
8
-
9
-
10
-
11
-
12
-
13
-
14
-
15
-
16
-
17
-
18
-
19
-
20
-
21
-
22
-
23
-
24
-
25
-
26
-
27
-
28
-
29
-
30
-
31
-
32
-
33
-
34
-
35
-
36
-
37
-
38
-
39
-
40
-
41
-
42
-
43
-
44
-
45
-
46
-
47
-
48
-
49
-
50
-
51
-
52
-
53
-
54
-
55
-
56
-
57
-
58
-
59
-
60
-
61
-
62
-
63
-
64
-
65
-
66
-
67
-
68
-
69
-
70
-
71
-
72
-
73
-
74
-
75
-
76
-
77
-
78
-
79
-
80
-
81
-
82
-
83
-
84
-
85
-
86
-
87
-
88
-
89
-
90
-
91
-
92
-
93
-
94
-
95
-
96
-
97
-
98
-
99
-
100
-
101
-
102
-
103
-
104
-
105
-
106
-
107
-
108
-
109
-
110
-
111
-
112
-
113
-
114
-
115
-
116
-
117
-
118
-
119
-
120
-
121
-
122
-
123
-
124
-
125
-
126
-
127
-
128
-
129
-
130
-
131
-
132
-
133
-
134
-
135
-
136
-
137
-
138
-
139
-
140
-
141
-
142
-
143
-
144
-
145
-
146
-
147
-
148
-
149
-
150
-
151
-
152
-
153
-
154
-
155
-
156
-
157
-
158
-
159
-
160
-
161
-
162
-
163
-
164
-
165
-
166
-
167
-
168
-
169
-
170
-
171
-
172
-
173
-
174
-
175
-
176
-
177
-
178
-
179
-
180
-
181
-
182
-
183
-
184
-
185
-
186
-
187
-
188
-
189
-
190
-
191
-
192
-
193
-
194
-
195
-
196
-
197
-
198
-
199
-
200
-
201
-
202
-
203
-
204
-
205
-
206
-
207
-
208
-
209
-
210
-
211
-
212
-
213
-
214
-
215
-
216
-
217
-
218
-
219
-
220
-
221
-
222
-
223
-
224
-
225
-
226
-
227
-
228
-
229
-
230
-
231
-
232
-
233
-
234
-
235
-
236
-
237
-
238
-
239
-
240
-
241
-
242
-
243
-
244
-
245
-
246
-
247
-
248
-
249
-
250
-
251
-
252
-
253
-
254
-
255
-
256
-
257
-
258
-
259
-
260
-
261
-
262
-
263
-
264
-
265
-
266
-
267
-
268
-
269
-
270
-
271
-
272
-
273
-
274
-
275
-
276
-
277
-
278
-
279
-
280
-
281
-
282
-
283
-
284
-
285
-
286
-
 287
287 -
 288
288 -
 289
289 -
 290
290 -
 291
291 -
 292
292 -
 293
293 -
 294
294 -
 295
295 -
 296
296 -
 297
297 -
 298
298 -
 299
299 -
 300
300
 |
 |

275 Capital One Financial Corporation (COF)
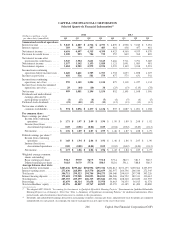
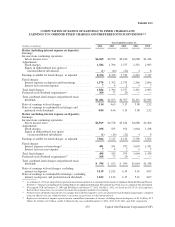
COMPUTATION OF RATIOS OF EARNINGS TO FIXED CHARGES AND
EARNINGS TO COMBINED FIXED CHARGES AND PREFERRED STOCK DIVIDENDS(1)(2)
Year Ended December 31,
(Dollars in millions) 2014 2013 2012 2011 2010
Ratios (including interest expense on deposits):
Earnings:
Income from continuing operations
before income taxes . . . . . . . . . . . . . . . . . . . . . . . . . . . . . . $6,569 $6,578 $5,184 $4,688 $4,406
Adjustments:
Fixed charges . . . . . . . . . . . . . . . . . . . . . . . . . . . . . . . . . . . 1,586 1,796 2,377 2,251 2,903
Equity in undistributed loss (gain) of
unconsolidated subsidiaries . . . . . . . . . . . . . . . . . . . . . . (1) (16) (22) 4 8
Earnings available for fixed charges, as adjusted . . . . . . . . . 8,154 8,358 7,539 6,943 7,317
Fixed charges:
Interest expense on deposits and borrowings . . . . . . . . . . 1,579 1,792 2,375 2,246 2,896
Interest factor in rent expense . . . . . . . . . . . . . . . . . . . . . . 742 57
Total fixed charges . . . . . . . . . . . . . . . . . . . . . . . . . . . . . . . . 1,586 1,796 2,377 2,251 2,903
Preferred stock dividend requirements(3) . . . . . . . . . . . . . . . . 100 77 20 — —
Total combined fixed charges and preferred stock
dividends . . . . . . . . . . . . . . . . . . . . . . . . . . . . . . . . . . . . . . $1,686 $1,873 $2,397 $2,251 $2,903
Ratio of earnings to fixed charges . . . . . . . . . . . . . . . . . . . . 5.14 4.65 3.17 3.08 2.52
Ratio of earnings to combined fixed charges and
preferred stock dividends . . . . . . . . . . . . . . . . . . . . . . . . . 4.84 4.46 3.15 3.08 2.52
Ratios (excluding interest expense on deposits):
Earnings:
Income from continuing operations
before income taxes . . . . . . . . . . . . . . . . . . . . . . . . . . . . . . $6,569 $6,578 $5,184 $4,688 $4,406
Adjustments:
Fixed charges . . . . . . . . . . . . . . . . . . . . . . . . . . . . . . . . . . . 498 555 974 1,064 1,438
Equity in undistributed loss (gain)
of unconsolidated subsidiaries . . . . . . . . . . . . . . . . . . . (1) (16) (22) 4 8
Earnings available for fixed charges, as adjusted . . . . . . . . . 7,066 7,117 6,136 5,756 5,852
Fixed charges:
Interest expense on borrowings(4) . . . . . . . . . . . . . . . . . . . . 491 551 972 1,059 1,431
Interest factor in rent expense . . . . . . . . . . . . . . . . . . . . . . 742 57
Total fixed charges . . . . . . . . . . . . . . . . . . . . . . . . . . . . . . . . 498 555 974 1,064 1,438
Preferred stock dividend requirements(3) . . . . . . . . . . . . . . . 100 77 20 — —
Total combined fixed charges and preferred stock
dividends . . . . . . . . . . . . . . . . . . . . . . . . . . . . . . . . . . . . . . $ 598 $ 632 $ 994 $1,064 $1,438
Ratio of earnings to fixed charges, excluding
interest on deposits . . . . . . . . . . . . . . . . . . . . . . . . . . . . . . 14.19 12.82 6.30 5.41 4.07
Ratio of earnings to combined fixed charges, excluding
interest on deposits, and preferred stock dividends . . . . . . 11.82 11.26 6.17 5.41 4.07
(1) As of January 1, 2014, we adopted the proportional amortization method of accounting for Investments in Qualified Affordable Housing Projects.
See Note 1—Summary of Significant Accounting Policies for additional information. Prior periods have been recast to conform to this presentation.
(2) We acquired CCB on February 27, 2009 and ING Direct on February 17, 2012. On May 1, 2012, we closed the 2012 U.S. card acquisition.
Each of these transactions was accounted for under the acquisition method of accounting.
(3) Preferred stock dividends represent pre-tax earnings that would be required to cover any preferred stock dividends requirements, computed
using our effective tax rate, whenever there is an income tax provision, for the relevant periods
(4) Represents total interest expense reported on our consolidated statements of income, excluding interest on deposits of $1.1 billion, $1.2
billion, $1.4 billion, $1.2 billion, and $1.5 billion for the years ended December 31, 2014, 2013, 2012, 2011, and 2010, respectively.
Exhibit 12.1