Capital One 2014 Annual Report Download - page 73
Download and view the complete annual report
Please find page 73 of the 2014 Capital One annual report below. You can navigate through the pages in the report by either clicking on the pages listed below, or by using the keyword search tool below to find specific information within the annual report.-
 1
1 -
2
-
3
-
4
-
5
-
6
-
7
-
8
-
9
-
10
-
11
-
12
-
13
-
14
-
15
-
16
-
17
-
18
-
19
-
20
-
21
-
22
-
23
-
24
-
25
-
26
-
27
-
28
-
29
-
30
-
31
-
32
-
33
-
34
-
35
-
36
-
37
-
38
-
39
-
40
-
41
-
42
-
43
-
44
-
45
-
46
-
47
-
48
-
49
-
50
-
51
-
52
-
53
-
54
-
55
-
56
-
57
-
58
-
59
-
60
-
61
-
62
-
 63
63 -
 64
64 -
 65
65 -
 66
66 -
 67
67 -
 68
68 -
 69
69 -
 70
70 -
 71
71 -
 72
72 -
 73
73 -
 74
74 -
 75
75 -
 76
76 -
 77
77 -
 78
78 -
 79
79 -
 80
80 -
 81
81 -
 82
82 -
 83
83 -
84
-
85
-
86
-
87
-
88
-
89
-
90
-
91
-
92
-
93
-
94
-
95
-
96
-
97
-
98
-
99
-
100
-
101
-
102
-
103
-
104
-
105
-
106
-
107
-
108
-
109
-
110
-
111
-
112
-
113
-
114
-
115
-
116
-
117
-
118
-
119
-
120
-
121
-
122
-
123
-
124
-
125
-
126
-
127
-
128
-
129
-
130
-
131
-
132
-
133
-
134
-
135
-
136
-
137
-
138
-
139
-
140
-
141
-
142
-
143
-
144
-
145
-
146
-
147
-
148
-
149
-
150
-
151
-
152
-
153
-
154
-
155
-
156
-
157
-
158
-
159
-
160
-
161
-
162
-
163
-
164
-
165
-
166
-
167
-
168
-
169
-
170
-
171
-
172
-
173
-
174
-
175
-
176
-
177
-
178
-
179
-
180
-
181
-
182
-
183
-
184
-
185
-
186
-
187
-
188
-
189
-
190
-
191
-
192
-
193
-
194
-
195
-
196
-
197
-
198
-
199
-
200
-
201
-
202
-
203
-
204
-
205
-
206
-
207
-
208
-
209
-
210
-
211
-
212
-
213
-
214
-
215
-
216
-
217
-
218
-
219
-
220
-
221
-
222
-
223
-
224
-
225
-
226
-
227
-
228
-
229
-
230
-
231
-
232
-
233
-
234
-
235
-
236
-
237
-
238
-
239
-
240
-
241
-
242
-
243
-
244
-
245
-
246
-
247
-
248
-
249
-
250
-
251
-
252
-
253
-
254
-
255
-
256
-
257
-
258
-
259
-
260
-
261
-
262
-
263
-
264
-
265
-
266
-
267
-
268
-
269
-
270
-
271
-
272
-
273
-
274
-
275
-
276
-
277
-
278
-
279
-
280
-
281
-
282
-
283
-
284
-
285
-
286
-
287
-
288
-
289
-
290
-
291
-
292
-
293
-
294
-
295
-
296
-
297
-
298
-
299
-
300
 |
 |

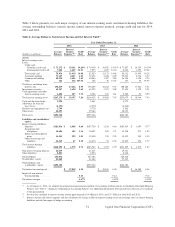
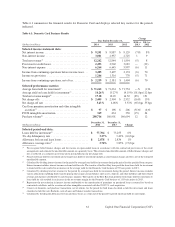
Table 2 below presents, for each major category of our interest-earning assets and interest-bearing liabilities, the
average outstanding balances, interest income earned, interest expense incurred, average yield and rate for 2014,
2013 and 2012.
Table 2: Average Balances, Net Interest Income and Net Interest Yield(1)
Year Ended December 31,
2014 2013 2012
Interest Interest Interest
Average Income/ Yield/ Average Income/ Yield/ Average Income/ Yield/
(Dollars in millions) Balance Expense(2)(3) Rate Balance Expense(2)(3) Rate Balance Expense(2)(3) Rate
Assets:
Interest-earning assets:
Loans:
Credit card:
Domestic credit card . . . . $ 71,272 $ 10,161 14.26% $ 74,950 $ 10,876 14.51% $ 71,857 $ 10,153 14.13%
International credit card . 7,684 1,269 16.51 7,973 1,295 16.24 8,255 1,292 15.66
Total credit card . . . . . . . . . 78,956 11,430 14.48 82,923 12,171 14.68 80,112 11,445 14.29
Consumer banking . . . . . . . 71,127 4,447 6.25 72,652 4,428 6.09 72,061 4,516 6.27
Commercial banking . . . . . . 48,210 1,649 3.42 40,866 1,587 3.88 36,136 1,528 4.23
Other . . . . . . . . . . . . . . . . . . 126 136 107.94 168 36 21.43 157 55 35.03
Total loans, including loans
held for sale . . . . . . . . . . . . 198,419 17,662 8.90 196,609 18,222 9.27 188,466 17,544 9.31
Investment securities . . . . . . . . 62,547 1,628 2.60 63,522 1,575 2.48 57,424 1,329 2.31
Cash equivalents and other
interest-earning assets . . . . . 6,208 107 1.72 6,292 101 1.61 9,189 91 0.99
Total interest-earning assets . . $267,174 $ 19,397 7.26 $266,423 $ 19,898 7.47 $255,079 $ 18,964 7.43
Cash and due from banks . . . . 2,994 2,461 4,573
Allowance for loan and
lease losses . . . . . . . . . . . . . (4,151) (4,572) (4,640)
Premises and equipment, net . 3,790 3,770 3,342
Other assets . . . . . . . . . . . . . . . 28,493 29,182 28,231
Total assets . . . . . . . . . . . . . . . $298,300 $297,264 $286,585
Liabilities and stockholders’
equity:
Interest-bearing liabilities:
Deposits . . . . . . . . . . . . . . . $181,036 $ 1,088 0.60 $187,700 $ 1,241 0.66 $183,314 $ 1,403 0.77
Securitized debt
obligations . . . . . . . . . . . 10,686 145 1.36 10,697 183 1.71 14,138 271 1.92
Senior and subordinated
notes . . . . . . . . . . . . . . . . 16,543 299 1.81 12,440 315 2.53 11,012 345 3.13
Other borrowings and
liabilities . . . . . . . . . . . . . 12,325 47 0.38 14,670 53 0.36 12,875 356 2.77
Total interest-bearing
liabilities . . . . . . . . . . . . . $220,590 $ 1,579 0.72 $225,507 $ 1,792 0.79 $221,339 $ 2,375 1.07
Non-interest bearing deposits . 24,639 21,345 19,741
Other liabilities . . . . . . . . . . . . 8,803 8,930 8,240
Total liabilities . . . . . . . . . . . . 254,032 255,782 249,320
Stockholders’ equity . . . . . . . . 44,268 41,482 37,265
Total liabilities and
stockholders’ equity . . . . . . $298,300 $297,264 $286,585
Net interest income/spread . . . $ 17,818 6.54 $ 18,106 6.68 $ 16,589 6.36
Impact of non-interest
bearing funding . . . . . . . . . . 0.13 0.12 0.14
Net interest margin . . . . . . . . . 6.67% 6.80% 6.50%
(1) As of January 1, 2014, we adopted the proportional amortization method of accounting for Investments in Qualified Affordable Housing
Projects. See “Note 1—Summary of Significant Accounting Policies” for additional information. Prior periods have been recast to conform
to this presentation.
(2) Past due fees included in interest income totaled approximately $1.4 billion in 2014, and $1.7 billion in both 2013 and 2012.
(3) Interest income and interest expense and the calculation of average yields on interest-earning assets and average rates on interest-bearing
liabilities include the impact of hedge accounting.
51 Capital One Financial Corporation (COF)