Capital One 2014 Annual Report Download - page 118
Download and view the complete annual report
Please find page 118 of the 2014 Capital One annual report below. You can navigate through the pages in the report by either clicking on the pages listed below, or by using the keyword search tool below to find specific information within the annual report.-
 1
1 -
2
-
3
-
4
-
5
-
6
-
7
-
8
-
9
-
10
-
11
-
12
-
13
-
14
-
15
-
16
-
17
-
18
-
19
-
20
-
21
-
22
-
23
-
24
-
25
-
26
-
27
-
28
-
29
-
30
-
31
-
32
-
33
-
34
-
35
-
36
-
37
-
38
-
39
-
40
-
41
-
42
-
43
-
44
-
45
-
46
-
47
-
48
-
49
-
50
-
51
-
52
-
53
-
54
-
55
-
56
-
57
-
58
-
59
-
60
-
61
-
62
-
63
-
64
-
65
-
66
-
67
-
68
-
69
-
70
-
71
-
72
-
73
-
74
-
75
-
76
-
77
-
78
-
79
-
80
-
81
-
82
-
83
-
84
-
85
-
86
-
87
-
88
-
89
-
90
-
91
-
92
-
93
-
94
-
95
-
96
-
97
-
98
-
99
-
100
-
101
-
102
-
103
-
104
-
105
-
106
-
107
-
 108
108 -
 109
109 -
 110
110 -
 111
111 -
 112
112 -
 113
113 -
 114
114 -
 115
115 -
 116
116 -
 117
117 -
 118
118 -
 119
119 -
 120
120 -
 121
121 -
 122
122 -
 123
123 -
 124
124 -
 125
125 -
 126
126 -
 127
127 -
 128
128 -
129
-
130
-
131
-
132
-
133
-
134
-
135
-
136
-
137
-
138
-
139
-
140
-
141
-
142
-
143
-
144
-
145
-
146
-
147
-
148
-
149
-
150
-
151
-
152
-
153
-
154
-
155
-
156
-
157
-
158
-
159
-
160
-
161
-
162
-
163
-
164
-
165
-
166
-
167
-
168
-
169
-
170
-
171
-
172
-
173
-
174
-
175
-
176
-
177
-
178
-
179
-
180
-
181
-
182
-
183
-
184
-
185
-
186
-
187
-
188
-
189
-
190
-
191
-
192
-
193
-
194
-
195
-
196
-
197
-
198
-
199
-
200
-
201
-
202
-
203
-
204
-
205
-
206
-
207
-
208
-
209
-
210
-
211
-
212
-
213
-
214
-
215
-
216
-
217
-
218
-
219
-
220
-
221
-
222
-
223
-
224
-
225
-
226
-
227
-
228
-
229
-
230
-
231
-
232
-
233
-
234
-
235
-
236
-
237
-
238
-
239
-
240
-
241
-
242
-
243
-
244
-
245
-
246
-
247
-
248
-
249
-
250
-
251
-
252
-
253
-
254
-
255
-
256
-
257
-
258
-
259
-
260
-
261
-
262
-
263
-
264
-
265
-
266
-
267
-
268
-
269
-
270
-
271
-
272
-
273
-
274
-
275
-
276
-
277
-
278
-
279
-
280
-
281
-
282
-
283
-
284
-
285
-
286
-
287
-
288
-
289
-
290
-
291
-
292
-
293
-
294
-
295
-
296
-
297
-
298
-
299
-
300
 |
 |

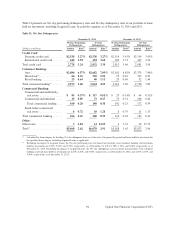
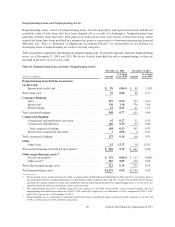
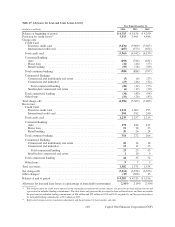
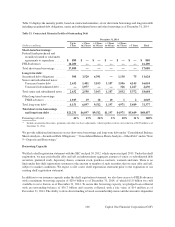
Nonperforming Loans and Nonperforming Assets
Nonperforming assets consist of nonperforming loans, foreclosed property and repossessed assets and the net
realizable value of auto loans that have been charged-off as a result of a bankruptcy. Nonperforming loans
generally include loans that have been placed on nonaccrual status and certain restructured loans whose
contractual terms have been modified in a manner that grants a concession to a borrower experiencing financial
difficulty. See “Note 1—Summary of Significant Accounting Policies” for information on our policies for
classifying loans as nonperforming for each of our loan categories.
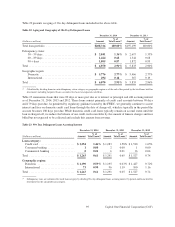
Table 24 presents comparative information on nonperforming loans, by portfolio segment, and other nonperforming
assets, as of December 31, 2014 and 2013. We do not classify loans held for sale as nonperforming, as they are
recorded at the lower of cost or fair value.
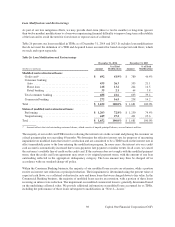
Table 24: Nonperforming Loans and Other Nonperforming Assets(1)
December 31, 2014 December 31, 2013
% of Total % of Total
(Dollars in millions) Amount Loans HFI Amount Loans HFI
Nonperforming loans held for investment:
Credit Card:
International credit card . . . . . . . . . . . . . . . . . . . . . . . . . . . . . . . $ 70 0.86% $ 88 1.10%
Total credit card . . . . . . . . . . . . . . . . . . . . . . . . . . . . . . . . . . . . . . . . . 70 0.08 88 0.11
Consumer Banking:
Auto . . . . . . . . . . . . . . . . . . . . . . . . . . . . . . . . . . . . . . . . . . . . . . 197 0.52 194 0.61
Home loan(2) . . . . . . . . . . . . . . . . . . . . . . . . . . . . . . . . . . . . . . . . 330 1.10 376 1.06
Retail banking . . . . . . . . . . . . . . . . . . . . . . . . . . . . . . . . . . . . . . 22 0.61 41 1.13
Total consumer banking(2) . . . . . . . . . . . . . . . . . . . . . . . . . . . . . . . . . 549 0.77 611 0.86
Commercial Banking:
Commercial and multifamily real estate . . . . . . . . . . . . . . . . . . 62 0.27 52 0.25
Commercial and industrial . . . . . . . . . . . . . . . . . . . . . . . . . . . . . 106 0.39 93 0.40
Total commercial lending . . . . . . . . . . . . . . . . . . . . . . . . . . . . 168 0.33 145 0.33
Small-ticket commercial real estate . . . . . . . . . . . . . . . . . . . . . . 7 0.96 4 0.41
Total commercial banking . . . . . . . . . . . . . . . . . . . . . . . . . . . . . . . . . 175 0.34 149 0.33
Other:
Other loans . . . . . . . . . . . . . . . . . . . . . . . . . . . . . . . . . . . . . . . . . 15 13.37 19 15.83
Total nonperforming loans held for investment(2)(3) . . . . . . . . . . . . . . $ 809 0.39 $ 867 0.44
Other nonperforming assets:(4)
Foreclosed property(5) . . . . . . . . . . . . . . . . . . . . . . . . . . . . . . . . . $ 139 0.06% $ 113 0.06%
Other assets(6) . . . . . . . . . . . . . . . . . . . . . . . . . . . . . . . . . . . . . . . 183 0.09 160 0.08
Total other nonperforming assets . . . . . . . . . . . . . . . . . . . . . . . . . . . 322 0.15 273 0.14
Total nonperforming assets . . . . . . . . . . . . . . . . . . . . . . . . . . . . . . . . $1,131 0.54 $1,140 0.58
(1) We recognized interest income for loans classified as nonperforming of $38 million and $40 million in 2014 and 2013, respectively. Interest
income forgone related to nonperforming loans was $49 million and $55 million in 2014 and 2013, respectively. Forgone interest income
represents the amount of interest income that would have been recorded during the period for nonperforming loans as of the end of the
period had the loans performed according to their contractual terms.
(2) The nonperforming loan ratio, excluding Acquired Loans’ impact for our home loan portfolio, total consumer banking, and total
nonperforming loans held for investment was 4.86%, 1.14%, and 0.44%, respectively, as of December 31, 2014, compared to 5.29%, 1.44%,
and 0.51%, respectively, as of December 31, 2013.
(3) Nonperforming loans as a percentage of total loans held for investment, excluding the impact of domestic credit card loans, was 0.62% and
0.70% as of December 31, 2014 and 2013, respectively.
96 Capital One Financial Corporation (COF)