Capital One 2014 Annual Report Download - page 256
Download and view the complete annual report
Please find page 256 of the 2014 Capital One annual report below. You can navigate through the pages in the report by either clicking on the pages listed below, or by using the keyword search tool below to find specific information within the annual report.-
 1
1 -
2
-
3
-
4
-
5
-
6
-
7
-
8
-
9
-
10
-
11
-
12
-
13
-
14
-
15
-
16
-
17
-
18
-
19
-
20
-
21
-
22
-
23
-
24
-
25
-
26
-
27
-
28
-
29
-
30
-
31
-
32
-
33
-
34
-
35
-
36
-
37
-
38
-
39
-
40
-
41
-
42
-
43
-
44
-
45
-
46
-
47
-
48
-
49
-
50
-
51
-
52
-
53
-
54
-
55
-
56
-
57
-
58
-
59
-
60
-
61
-
62
-
63
-
64
-
65
-
66
-
67
-
68
-
69
-
70
-
71
-
72
-
73
-
74
-
75
-
76
-
77
-
78
-
79
-
80
-
81
-
82
-
83
-
84
-
85
-
86
-
87
-
88
-
89
-
90
-
91
-
92
-
93
-
94
-
95
-
96
-
97
-
98
-
99
-
100
-
101
-
102
-
103
-
104
-
105
-
106
-
107
-
108
-
109
-
110
-
111
-
112
-
113
-
114
-
115
-
116
-
117
-
118
-
119
-
120
-
121
-
122
-
123
-
124
-
125
-
126
-
127
-
128
-
129
-
130
-
131
-
132
-
133
-
134
-
135
-
136
-
137
-
138
-
139
-
140
-
141
-
142
-
143
-
144
-
145
-
146
-
147
-
148
-
149
-
150
-
151
-
152
-
153
-
154
-
155
-
156
-
157
-
158
-
159
-
160
-
161
-
162
-
163
-
164
-
165
-
166
-
167
-
168
-
169
-
170
-
171
-
172
-
173
-
174
-
175
-
176
-
177
-
178
-
179
-
180
-
181
-
182
-
183
-
184
-
185
-
186
-
187
-
188
-
189
-
190
-
191
-
192
-
193
-
194
-
195
-
196
-
197
-
198
-
199
-
200
-
201
-
202
-
203
-
204
-
205
-
206
-
207
-
208
-
209
-
210
-
211
-
212
-
213
-
214
-
215
-
216
-
217
-
218
-
219
-
220
-
221
-
222
-
223
-
224
-
225
-
226
-
227
-
228
-
229
-
230
-
231
-
232
-
233
-
234
-
235
-
236
-
237
-
238
-
239
-
240
-
241
-
242
-
243
-
244
-
245
-
 246
246 -
 247
247 -
 248
248 -
 249
249 -
 250
250 -
 251
251 -
 252
252 -
 253
253 -
 254
254 -
 255
255 -
 256
256 -
 257
257 -
 258
258 -
 259
259 -
 260
260 -
 261
261 -
 262
262 -
 263
263 -
 264
264 -
 265
265 -
 266
266 -
267
-
268
-
269
-
270
-
271
-
272
-
273
-
274
-
275
-
276
-
277
-
278
-
279
-
280
-
281
-
282
-
283
-
284
-
285
-
286
-
287
-
288
-
289
-
290
-
291
-
292
-
293
-
294
-
295
-
296
-
297
-
298
-
299
-
300
 |
 |

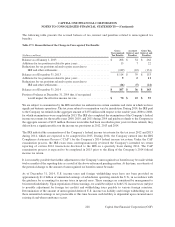
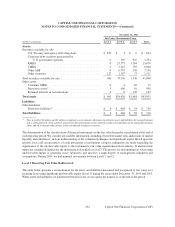
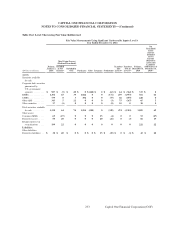
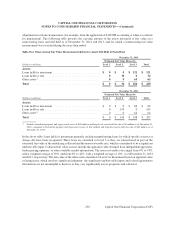
Fair Value Measurements Using Significant Unobservable Inputs (Level 3)
Year Ended December 31, 2013
Net
Unrealized
Gains
(Losses)
Included
in Net
Income
Total Gains (Losses) Related to
(Realized/Unrealized) Assets and
Liabilities
Balance, Included Transfers Transfers Balance, Still Held as of
January 1, in Net Included in Into Out of December 31, December 31,
(Dollars in millions) 2013 Income(1) OCI Purchases Sales Issuances Settlements Level 3(2) Level 3(2) 2013 2013(3)
Assets:
Securities available
for sale:
Corporate debt securities
guaranteed by
U.S. government
agencies . . . . . . . . . $ 650 $ 0 $ (39) $ 272 $ 0 $ 0 $ (67) $ 156 $ (45) $ 927 $ 0
RMBS . . . . . . . . . . . . . 1,335 (16) 203 287 0 0 (239) 794 (1,060) 1,304 (20)
CMBS . . . . . . . . . . . . . 587 0 (57) 1,085 (10) 0 11 284 (1,161) 739 0
Other ABS . . . . . . . . . 102 (1) 14 279 (56) 0 (2) 103 (96) 343 (1)
Other securities . . . . . 15 0 0 32 (23) 0 (7) 1 (1) 17 0
Total securities
available for sale . . 2,689 (17) 121 1,955 (89) 0 (304) 1,338 (2,363) 3,330 (21)
Other assets:
Consumer MSRs . . . . 55 34 0 0 0 13 (7) 0 (26) 69 18
Derivative assets . . . . . 90 (22) 0 0 0 10 (19) 0 (9) 50 (22)
Retained interest
in securitization . . . 204 (5) 0 0 0 0 0 0 0 199 (5)
Liabilities:
Other liabilities:
Derivative liabilities . . $ 38 $ 14 $ 0 $ 0 $ 0 $ 14 $ (28) $ 1 $ (1) $ 38 $ 14
(1) Gains (losses) related to Level 3 Consumer MSRs, derivative assets and derivative liabilities, and retained interests in securitizations are reported
in other non-interest income, which is a component of non-interest income, in our consolidated statements of income.
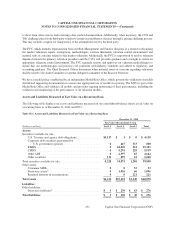
(2) During the years ended December 31, 2014 and 2013, the transfers into Level 3 were primarily driven by less consistency among vendor pricing
on individual securities, while the transfers out of Level 3 for 2014 and 2013 were primarily driven by greater consistency among multiple
pricing sources.
(3) The amount presented for unrealized gains (losses) for assets still held as of the reporting date primarily represents impairments of securities
available for sale, accretion on certain fixed maturity securities, changes in fair value of derivative instruments and mortgage servicing rights
transactions. Impairment is reported in total other-than-temporary impairment, which is a component of non-interest income, in our consolidated
statements of income.
234
CAPITAL ONE FINANCIAL CORPORATION
NOTES TO CONSOLIDATED FINANCIAL STATEMENTS—(Continued)
Capital One Financial Corporation (COF)