Capital One 2014 Annual Report Download - page 264
Download and view the complete annual report
Please find page 264 of the 2014 Capital One annual report below. You can navigate through the pages in the report by either clicking on the pages listed below, or by using the keyword search tool below to find specific information within the annual report.-
 1
1 -
2
-
3
-
4
-
5
-
6
-
7
-
8
-
9
-
10
-
11
-
12
-
13
-
14
-
15
-
16
-
17
-
18
-
19
-
20
-
21
-
22
-
23
-
24
-
25
-
26
-
27
-
28
-
29
-
30
-
31
-
32
-
33
-
34
-
35
-
36
-
37
-
38
-
39
-
40
-
41
-
42
-
43
-
44
-
45
-
46
-
47
-
48
-
49
-
50
-
51
-
52
-
53
-
54
-
55
-
56
-
57
-
58
-
59
-
60
-
61
-
62
-
63
-
64
-
65
-
66
-
67
-
68
-
69
-
70
-
71
-
72
-
73
-
74
-
75
-
76
-
77
-
78
-
79
-
80
-
81
-
82
-
83
-
84
-
85
-
86
-
87
-
88
-
89
-
90
-
91
-
92
-
93
-
94
-
95
-
96
-
97
-
98
-
99
-
100
-
101
-
102
-
103
-
104
-
105
-
106
-
107
-
108
-
109
-
110
-
111
-
112
-
113
-
114
-
115
-
116
-
117
-
118
-
119
-
120
-
121
-
122
-
123
-
124
-
125
-
126
-
127
-
128
-
129
-
130
-
131
-
132
-
133
-
134
-
135
-
136
-
137
-
138
-
139
-
140
-
141
-
142
-
143
-
144
-
145
-
146
-
147
-
148
-
149
-
150
-
151
-
152
-
153
-
154
-
155
-
156
-
157
-
158
-
159
-
160
-
161
-
162
-
163
-
164
-
165
-
166
-
167
-
168
-
169
-
170
-
171
-
172
-
173
-
174
-
175
-
176
-
177
-
178
-
179
-
180
-
181
-
182
-
183
-
184
-
185
-
186
-
187
-
188
-
189
-
190
-
191
-
192
-
193
-
194
-
195
-
196
-
197
-
198
-
199
-
200
-
201
-
202
-
203
-
204
-
205
-
206
-
207
-
208
-
209
-
210
-
211
-
212
-
213
-
214
-
215
-
216
-
217
-
218
-
219
-
220
-
221
-
222
-
223
-
224
-
225
-
226
-
227
-
228
-
229
-
230
-
231
-
232
-
233
-
234
-
235
-
236
-
237
-
238
-
239
-
240
-
241
-
242
-
243
-
244
-
245
-
246
-
247
-
248
-
249
-
250
-
251
-
252
-
253
-
 254
254 -
 255
255 -
 256
256 -
 257
257 -
 258
258 -
 259
259 -
 260
260 -
 261
261 -
 262
262 -
 263
263 -
 264
264 -
 265
265 -
 266
266 -
 267
267 -
 268
268 -
 269
269 -
 270
270 -
 271
271 -
 272
272 -
 273
273 -
 274
274 -
275
-
276
-
277
-
278
-
279
-
280
-
281
-
282
-
283
-
284
-
285
-
286
-
287
-
288
-
289
-
290
-
291
-
292
-
293
-
294
-
295
-
296
-
297
-
298
-
299
-
300
 |
 |
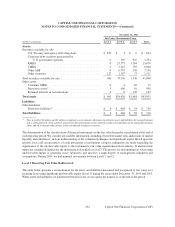
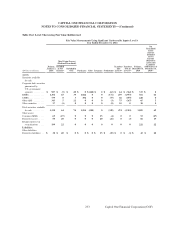
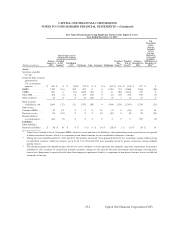
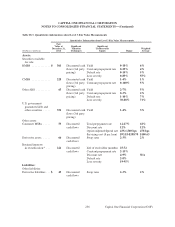
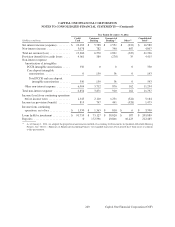
Due to the use of significant unobservable inputs, loans held for investment are classified as Level 3 under the fair
value hierarchy. Fair value adjustments for individually impaired collateralized loans held for investment are recorded
in provision for credit losses in the consolidated statements of income.
Loans Held For Sale
Loans held for sale are carried at the lower of aggregate cost, net of deferred fees and deferred origination costs, or fair
value. We originate loans with the intent to sell them. Commercial loans are sold to government-sponsored enterprises
as part of a delegated underwriting and servicing (“DUS”) program. For DUS commercial loans, the fair value is
estimated primarily using contractual prices and other observable market-based inputs. For residential mortgage loans
classified as held for sale, the fair value is estimated using observable market prices for loans with similar characteristics
as the primary component, with the secondary component derived from typical securitization activities and market
conditions. Credit card loans held for sale are valued based on other observable market-based inputs. These assets are
therefore classified as Level 2. Fair value adjustments to loans held for sale are recorded in other non-interest income
in our consolidated statements of income.
Interest Receivable
The carrying amount of interest receivable approximates the fair value of this asset due to its relatively short-term
nature.
Derivative Assets and Liabilities
We use both exchange-traded derivatives and OTC derivatives to manage our interest rate and foreign currency risk
exposure. Quoted market prices are available and used for our exchange-traded derivatives, which we classify as Level
1. However, substantially all of our derivatives are traded in OTC markets where quoted market prices are not always
readily available. Therefore, we value most OTC derivatives using valuation techniques, which include internally-
developed models. We primarily rely on market observable inputs for our models, such as interest rate yield curves,
credit curves, option volatility and currency rates, that vary depending on the type of derivative and nature of the
underlying rate, price or index upon which the derivative’s value is based. Where model inputs can be observed in a
liquid market and the model does not require significant judgment, such derivatives are typically classified as Level 2
of the fair value hierarchy. When instruments are traded in less liquid markets and significant inputs are unobservable,
such as interest rate swaps whose remaining terms do not correlate with market observable interest rate yield curves,
the derivatives are classified as Level 3.
The impact of counterparty non-performance risk is considered when measuring the fair value of derivative assets.
These derivatives are included in other assets on the consolidated balance sheets.
We validate the pricing obtained from the internal models through comparison of pricing to additional sources,
including external valuation agents and other internal sources. Pricing variances among different pricing sources
are analyzed and validated.
Mortgage Servicing Rights
We record consumer MSRs at fair value on a recurring basis, while commercial MSRs are subsequently measured at
amortized cost with impairment recognized as a reduction in other non-interest income. MSRs do not trade in an active
market with readily observable prices. Accordingly, we determine the fair value of MSRs using a valuation model that
calculates the present value of estimated future net servicing income. The model incorporates assumptions that we
believe other market participants use in estimating future net servicing income, including estimates of prepayment
242
CAPITAL ONE FINANCIAL CORPORATION
NOTES TO CONSOLIDATED FINANCIAL STATEMENTS—(Continued)
Capital One Financial Corporation (COF)