Capital One 2014 Annual Report Download - page 62
Download and view the complete annual report
Please find page 62 of the 2014 Capital One annual report below. You can navigate through the pages in the report by either clicking on the pages listed below, or by using the keyword search tool below to find specific information within the annual report.-
 1
1 -
2
-
3
-
4
-
5
-
6
-
7
-
8
-
9
-
10
-
11
-
12
-
13
-
14
-
15
-
16
-
17
-
18
-
19
-
20
-
21
-
22
-
23
-
24
-
25
-
26
-
27
-
28
-
29
-
30
-
31
-
32
-
33
-
34
-
35
-
36
-
37
-
38
-
39
-
40
-
41
-
42
-
43
-
44
-
45
-
46
-
47
-
48
-
49
-
50
-
51
-
 52
52 -
 53
53 -
 54
54 -
 55
55 -
 56
56 -
 57
57 -
 58
58 -
 59
59 -
 60
60 -
 61
61 -
 62
62 -
 63
63 -
 64
64 -
 65
65 -
 66
66 -
 67
67 -
 68
68 -
 69
69 -
 70
70 -
 71
71 -
 72
72 -
73
-
74
-
75
-
76
-
77
-
78
-
79
-
80
-
81
-
82
-
83
-
84
-
85
-
86
-
87
-
88
-
89
-
90
-
91
-
92
-
93
-
94
-
95
-
96
-
97
-
98
-
99
-
100
-
101
-
102
-
103
-
104
-
105
-
106
-
107
-
108
-
109
-
110
-
111
-
112
-
113
-
114
-
115
-
116
-
117
-
118
-
119
-
120
-
121
-
122
-
123
-
124
-
125
-
126
-
127
-
128
-
129
-
130
-
131
-
132
-
133
-
134
-
135
-
136
-
137
-
138
-
139
-
140
-
141
-
142
-
143
-
144
-
145
-
146
-
147
-
148
-
149
-
150
-
151
-
152
-
153
-
154
-
155
-
156
-
157
-
158
-
159
-
160
-
161
-
162
-
163
-
164
-
165
-
166
-
167
-
168
-
169
-
170
-
171
-
172
-
173
-
174
-
175
-
176
-
177
-
178
-
179
-
180
-
181
-
182
-
183
-
184
-
185
-
186
-
187
-
188
-
189
-
190
-
191
-
192
-
193
-
194
-
195
-
196
-
197
-
198
-
199
-
200
-
201
-
202
-
203
-
204
-
205
-
206
-
207
-
208
-
209
-
210
-
211
-
212
-
213
-
214
-
215
-
216
-
217
-
218
-
219
-
220
-
221
-
222
-
223
-
224
-
225
-
226
-
227
-
228
-
229
-
230
-
231
-
232
-
233
-
234
-
235
-
236
-
237
-
238
-
239
-
240
-
241
-
242
-
243
-
244
-
245
-
246
-
247
-
248
-
249
-
250
-
251
-
252
-
253
-
254
-
255
-
256
-
257
-
258
-
259
-
260
-
261
-
262
-
263
-
264
-
265
-
266
-
267
-
268
-
269
-
270
-
271
-
272
-
273
-
274
-
275
-
276
-
277
-
278
-
279
-
280
-
281
-
282
-
283
-
284
-
285
-
286
-
287
-
288
-
289
-
290
-
291
-
292
-
293
-
294
-
295
-
296
-
297
-
298
-
299
-
300
 |
 |
$2.0 billion of common stock and expect to complete the 2014 Stock Repurchase Program by the end of the first
quarter of 2015. See “Capital Management” below for additional information.
Below are additional highlights of our performance in 2014. These highlights generally are based on a comparison
between the results of 2014 and 2013, except as otherwise noted. The changes in our financial condition and credit
performance are generally based on our financial condition and credit performance as of December 31, 2014
compared to our financial condition and credit performance as of December 31, 2013. We provide a more detailed
discussion of our financial performance in the sections following this “Executive Summary and Business Outlook.”
Total Company
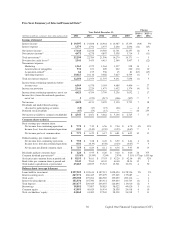
•Earnings: Our net income increased by $307 million, or 7%, to $4.4 billion in 2014, compared to $4.1 billion in
2013. The increase in net income was driven by (i) a $342 million change driven by a net benefit of $33 million
for mortgage representation and warranty losses (which includes a benefit of $26 million before taxes in
continuing operations and a benefit of $7 million before taxes in discontinued operations) in 2014, as compared
to a net provision of $309 million (which includes a benefit of $24 million before taxes in continuing operations
and a provision of $333 million before taxes in discontinued operations) in 2013; (ii) a decrease in non-interest
expense due to lower amortization of intangibles, acquisition-related costs and the provision for litigation matters;
and (iii) an increase in net interest income due to lower funding costs. These items were partially offset by a
decrease in net interest income attributable to the Portfolio Sale and higher marketing expenses associated with
loan growth.
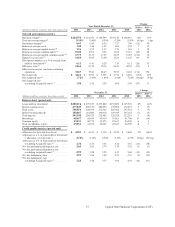
•Loans Held for Investment: Period-end loans held for investment increased by $11.1 billion, or 6%, to $208.3
billion as of December 31, 2014 from $197.2 billion as of December 31, 2013. Average loans held for
investment increased by $5.3 billion, or 3%, to $197.9 billion in 2014, compared to $192.6 billion in 2013. The
increases were due to growth in our credit card and commercial loan portfolios, and continued strong auto loan
originations outpacing the run-off of the acquired home loan portfolio in our Consumer Banking business.
•Net Charge-off and Delinquency Statistics: Our net charge-off rate decreased by 32 basis points to 1.72% in
2014 from 2.04% in 2013. The low net charge-off rates observed during 2014, compared to our historical trends,
were largely due to continued economic improvement and portfolio seasoning. Our 30+ day delinquency
rate declined to 2.91% as of December 31, 2014 from 2.96% as of December 31, 2013. The decrease was
primarily due to strong credit performance. We provide additional information on our credit quality metrics
below under “Business Segment Financial Performance” and “Credit Risk Profile.”
•Allowance for Loan and Lease Losses: Our allowance for loan and lease losses increased by $68 million to
$4.4 billion as of December 31, 2014, from $4.3 billion as of December 31, 2013. The increase in the
allowance for loan and lease losses was primarily driven by loan growth in our domestic card, auto and
commercial loan portfolios, in addition to portfolio specific risks in our commercial loan portfolio, offset by
credit improvement driving allowance releases related to our international card portfolio. The allowance
coverage ratio declined by 9 basis points to 2.10% as of December 31, 2014 from 2.19% as of December 31,
2013 primarily resulting from the increase in the outstanding balances in loans held for investment outpacing
the allowance build.
•Representation and Warranty Reserve: The mortgage representation and warranty reserve decreased by $441
million to $731 million as of December 31, 2014, from $1.2 billion as of December 31, 2013. We recorded
a net benefit for mortgage representation and warranty losses of $33 million (which includes a benefit of
$26 million before taxes in continuing operations and a benefit of $7 million before taxes in discontinued
operations) in 2014. The decrease in the representation and warranty reserve was primarily driven by claims
paid and legal developments including settlements.
40 Capital One Financial Corporation (COF)