Capital One 2014 Annual Report Download - page 123
Download and view the complete annual report
Please find page 123 of the 2014 Capital One annual report below. You can navigate through the pages in the report by either clicking on the pages listed below, or by using the keyword search tool below to find specific information within the annual report.-
 1
1 -
2
-
3
-
4
-
5
-
6
-
7
-
8
-
9
-
10
-
11
-
12
-
13
-
14
-
15
-
16
-
17
-
18
-
19
-
20
-
21
-
22
-
23
-
24
-
25
-
26
-
27
-
28
-
29
-
30
-
31
-
32
-
33
-
34
-
35
-
36
-
37
-
38
-
39
-
40
-
41
-
42
-
43
-
44
-
45
-
46
-
47
-
48
-
49
-
50
-
51
-
52
-
53
-
54
-
55
-
56
-
57
-
58
-
59
-
60
-
61
-
62
-
63
-
64
-
65
-
66
-
67
-
68
-
69
-
70
-
71
-
72
-
73
-
74
-
75
-
76
-
77
-
78
-
79
-
80
-
81
-
82
-
83
-
84
-
85
-
86
-
87
-
88
-
89
-
90
-
91
-
92
-
93
-
94
-
95
-
96
-
97
-
98
-
99
-
100
-
101
-
102
-
103
-
104
-
105
-
106
-
107
-
108
-
109
-
110
-
111
-
112
-
 113
113 -
 114
114 -
 115
115 -
 116
116 -
 117
117 -
 118
118 -
 119
119 -
 120
120 -
 121
121 -
 122
122 -
 123
123 -
 124
124 -
 125
125 -
 126
126 -
 127
127 -
 128
128 -
 129
129 -
 130
130 -
 131
131 -
 132
132 -
 133
133 -
134
-
135
-
136
-
137
-
138
-
139
-
140
-
141
-
142
-
143
-
144
-
145
-
146
-
147
-
148
-
149
-
150
-
151
-
152
-
153
-
154
-
155
-
156
-
157
-
158
-
159
-
160
-
161
-
162
-
163
-
164
-
165
-
166
-
167
-
168
-
169
-
170
-
171
-
172
-
173
-
174
-
175
-
176
-
177
-
178
-
179
-
180
-
181
-
182
-
183
-
184
-
185
-
186
-
187
-
188
-
189
-
190
-
191
-
192
-
193
-
194
-
195
-
196
-
197
-
198
-
199
-
200
-
201
-
202
-
203
-
204
-
205
-
206
-
207
-
208
-
209
-
210
-
211
-
212
-
213
-
214
-
215
-
216
-
217
-
218
-
219
-
220
-
221
-
222
-
223
-
224
-
225
-
226
-
227
-
228
-
229
-
230
-
231
-
232
-
233
-
234
-
235
-
236
-
237
-
238
-
239
-
240
-
241
-
242
-
243
-
244
-
245
-
246
-
247
-
248
-
249
-
250
-
251
-
252
-
253
-
254
-
255
-
256
-
257
-
258
-
259
-
260
-
261
-
262
-
263
-
264
-
265
-
266
-
267
-
268
-
269
-
270
-
271
-
272
-
273
-
274
-
275
-
276
-
277
-
278
-
279
-
280
-
281
-
282
-
283
-
284
-
285
-
286
-
287
-
288
-
289
-
290
-
291
-
292
-
293
-
294
-
295
-
296
-
297
-
298
-
299
-
300
 |
 |

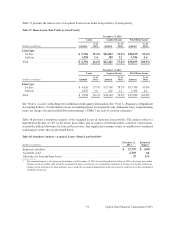
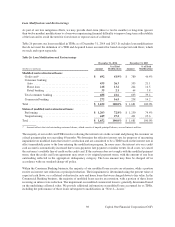
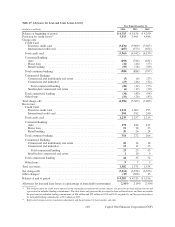
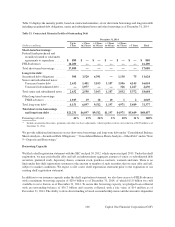
Table 28 presents an allocation of our allowance for loan and lease losses by portfolio segment as of December 31,
2014 and 2013.
Table 28: Allocation of the Allowance for Loan and Lease Losses
December 31, 2014 December 31, 2013
% of Total % of Total
(Dollars in millions) Amount Loans HFI Amount Loans HFI
Credit Card:
Domestic credit card . . . . . . . . . . . . . . . . . . . . . . . . . . . . . . . . . . . . $ 2,878 3.70% $ 2,836 3.87%
International credit card . . . . . . . . . . . . . . . . . . . . . . . . . . . . . . . . . 326 3.99 378 4.70
Total credit card . . . . . . . . . . . . . . . . . . . . . . . . . . . . . . . . . . . . . . . . . . 3,204 3.73 3,214 3.95
Consumer Banking:
Auto . . . . . . . . . . . . . . . . . . . . . . . . . . . . . . . . . . . . . . . . . . . . . . . . . 661 1.75 606 1.90
Home loan(1) . . . . . . . . . . . . . . . . . . . . . . . . . . . . . . . . . . . . . . . . . . . 62 0.21 83 0.24
Retail banking . . . . . . . . . . . . . . . . . . . . . . . . . . . . . . . . . . . . . . . . . 56 1.58 63 1.74
Total consumer banking(1) . . . . . . . . . . . . . . . . . . . . . . . . . . . . . . . . . . 779 1.09 752 1.06
Commercial Banking:
Commercial and multifamily real estate . . . . . . . . . . . . . . . . . . . . . 155 0.67 143 0.69
Commercial and industrial . . . . . . . . . . . . . . . . . . . . . . . . . . . . . . . 229 0.85 166 0.71
Total commercial lending . . . . . . . . . . . . . . . . . . . . . . . . . . . . . . 384 0.77 309 0.70
Small-ticket commercial real estate . . . . . . . . . . . . . . . . . . . . . . . . 11 1.43 29 3.05
Total commercial banking . . . . . . . . . . . . . . . . . . . . . . . . . . . . . . . . . . 395 0.78 338 0.75
Other loans . . . . . . . . . . . . . . . . . . . . . . . . . . . . . . . . . . . . . . . . . . . . . 5 4.68 11 9.09
Total allowance for loan and lease losses . . . . . . . . . . . . . . . . . . . . . . $ 4,383 2.10 $ 4,315 2.19
Total allowance coverage ratios:
Period-end loans held for investment . . . . . . . . . . . . . . . . . . . . . . . . . $208,316 2.10 $197,199 2.19
Period-end loans held for investment (excluding Acquired Loans) . . 184,816 2.36 168,649 2.54
Nonperforming loans(2) . . . . . . . . . . . . . . . . . . . . . . . . . . . . . . . . . . . . 809 541.86 867 497.69
Allowance coverage ratios by loan category:(3)
Credit card (30+ day delinquent loans) . . . . . . . . . . . . . . . . . . . . . . . . 2,832 113.13 2,881 111.56
Consumer banking (30+ day delinquent loans) . . . . . . . . . . . . . . . . . 3,024 25.76 2,750 27.35
Commercial banking (nonperforming loans) . . . . . . . . . . . . . . . . . . . 175 225.86 149 226.85
(1) Excluding the Acquired Loans’ impact, the coverage ratio for home loans and total consumer banking was 0.52% and 1.56%, respectively,
as of December 31, 2014, compared to 0.64% and 1.68%, respectively, as of December 31, 2013.
(2) The allowance for loan and lease losses as a percentage of nonperforming loans, excluding the allowance for loan and lease losses related
to our domestic credit card loans, was 186.07% as of December 31, 2014, and 170.59% as of December 31, 2013.
(3) Calculated based on the total allowance for loan and lease losses divided by the outstanding balance of loans within the specified loan
category.
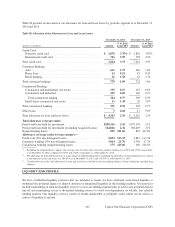
LIQUIDITY RISK PROFILE
We have established liquidity practices that are intended to ensure we have sufficient asset-based liquidity to
withstand the potential impact of deposit attrition or diminished liquidity in the funding markets. Our practices
include maintaining an adequate liquidity reserve to cover our funding requirements as well as any potential deposit
run-off and maintaining access to diversified funding sources to avoid over-dependence on volatile, less reliable
funding markets. Our liquidity reserves consist of readily-marketable or pledgable assets which can be used as a
source of liquidity, if needed.
101 Capital One Financial Corporation (COF)