Capital One 2014 Annual Report Download - page 198
Download and view the complete annual report
Please find page 198 of the 2014 Capital One annual report below. You can navigate through the pages in the report by either clicking on the pages listed below, or by using the keyword search tool below to find specific information within the annual report.-
 1
1 -
2
-
3
-
4
-
5
-
6
-
7
-
8
-
9
-
10
-
11
-
12
-
13
-
14
-
15
-
16
-
17
-
18
-
19
-
20
-
21
-
22
-
23
-
24
-
25
-
26
-
27
-
28
-
29
-
30
-
31
-
32
-
33
-
34
-
35
-
36
-
37
-
38
-
39
-
40
-
41
-
42
-
43
-
44
-
45
-
46
-
47
-
48
-
49
-
50
-
51
-
52
-
53
-
54
-
55
-
56
-
57
-
58
-
59
-
60
-
61
-
62
-
63
-
64
-
65
-
66
-
67
-
68
-
69
-
70
-
71
-
72
-
73
-
74
-
75
-
76
-
77
-
78
-
79
-
80
-
81
-
82
-
83
-
84
-
85
-
86
-
87
-
88
-
89
-
90
-
91
-
92
-
93
-
94
-
95
-
96
-
97
-
98
-
99
-
100
-
101
-
102
-
103
-
104
-
105
-
106
-
107
-
108
-
109
-
110
-
111
-
112
-
113
-
114
-
115
-
116
-
117
-
118
-
119
-
120
-
121
-
122
-
123
-
124
-
125
-
126
-
127
-
128
-
129
-
130
-
131
-
132
-
133
-
134
-
135
-
136
-
137
-
138
-
139
-
140
-
141
-
142
-
143
-
144
-
145
-
146
-
147
-
148
-
149
-
150
-
151
-
152
-
153
-
154
-
155
-
156
-
157
-
158
-
159
-
160
-
161
-
162
-
163
-
164
-
165
-
166
-
167
-
168
-
169
-
170
-
171
-
172
-
173
-
174
-
175
-
176
-
177
-
178
-
179
-
180
-
181
-
182
-
183
-
184
-
185
-
186
-
187
-
 188
188 -
 189
189 -
 190
190 -
 191
191 -
 192
192 -
 193
193 -
 194
194 -
 195
195 -
 196
196 -
 197
197 -
 198
198 -
 199
199 -
 200
200 -
 201
201 -
 202
202 -
 203
203 -
 204
204 -
 205
205 -
 206
206 -
 207
207 -
 208
208 -
209
-
210
-
211
-
212
-
213
-
214
-
215
-
216
-
217
-
218
-
219
-
220
-
221
-
222
-
223
-
224
-
225
-
226
-
227
-
228
-
229
-
230
-
231
-
232
-
233
-
234
-
235
-
236
-
237
-
238
-
239
-
240
-
241
-
242
-
243
-
244
-
245
-
246
-
247
-
248
-
249
-
250
-
251
-
252
-
253
-
254
-
255
-
256
-
257
-
258
-
259
-
260
-
261
-
262
-
263
-
264
-
265
-
266
-
267
-
268
-
269
-
270
-
271
-
272
-
273
-
274
-
275
-
276
-
277
-
278
-
279
-
280
-
281
-
282
-
283
-
284
-
285
-
286
-
287
-
288
-
289
-
290
-
291
-
292
-
293
-
294
-
295
-
296
-
297
-
298
-
299
-
300
 |
 |

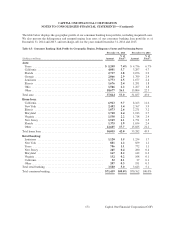
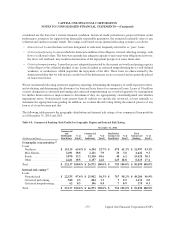
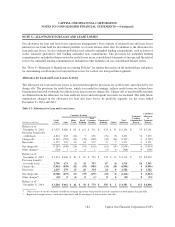
176
December 31, 2013
Commercial
and Commercial Small-ticket Total
Multifamily % of and % of Commercial % of Commercial % of
(Dollars in millions) Real Estate Total(1) Industrial Total(1) Real Estate Total(1) Banking Total(1)
Geographic concentration:(2)
Loans:
Northeast . . . . . . . . . . . . . . . $ 14,551 70.1% $ 5,823 25.0% $ 582 61.1% $ 20,956 46.5%
Mid-Atlantic . . . . . . . . . . . . . 2,194 10.6 1,585 6.8 33 3.5 3,812 8.5
South . . . . . . . . . . . . . . . . . . 2,541 12.2 10,941 46.9 58 6.1 13,540 30.1
Other . . . . . . . . . . . . . . . . . . . 1,464 7.1 4,960 21.3 279 29.3 6,703 14.9
Total . . . . . . . . . . . . . . . . . . . . . $ 20,750 100.0% $ 23,309 100.0% $ 952 100.0% $ 45,011 100.0%
Internal risk rating:(3)
Loans:
Noncriticized . . . . . . . . . . . . $ 20,276 97.7% $ 22,606 97.0% $ 941 98.9% $ 43,823 97.4%
Criticized performing . . . . . . 421 2.1 610 2.6 8 0.8 1,039 2.3
Criticized nonperforming . . . 53 0.2 93 0.4 3 0.3 149 0.3
Total . . . . . . . . . . . . . . . . . . . . . $ 20,750 100.0% $ 23,309 100.0% $ 952 100.0% $ 45,011 100.0%
(1) Percentages calculated based on total held-for-investment commercial loans in each respective loan category as of the end of the reported
period.
(2) Northeast consists of CT, ME, MA, NH, NJ, NY, PA and VT. Mid-Atlantic consists of DE, DC, MD, VA and WV. South consists of AL,
AR, FL, GA, KY, LA, MS, MO, NC, SC, TN and TX.
(3) Criticized exposures correspond to the “Special Mention,” “Substandard” and “Doubtful” asset categories defined by banking regulatory
authorities.
CAPITAL ONE FINANCIAL CORPORATION
NOTES TO CONSOLIDATED FINANCIAL STATEMENTS—(Continued)
Capital One Financial Corporation (COF)