Capital One 2014 Annual Report Download - page 79
Download and view the complete annual report
Please find page 79 of the 2014 Capital One annual report below. You can navigate through the pages in the report by either clicking on the pages listed below, or by using the keyword search tool below to find specific information within the annual report.-
 1
1 -
2
-
3
-
4
-
5
-
6
-
7
-
8
-
9
-
10
-
11
-
12
-
13
-
14
-
15
-
16
-
17
-
18
-
19
-
20
-
21
-
22
-
23
-
24
-
25
-
26
-
27
-
28
-
29
-
30
-
31
-
32
-
33
-
34
-
35
-
36
-
37
-
38
-
39
-
40
-
41
-
42
-
43
-
44
-
45
-
46
-
47
-
48
-
49
-
50
-
51
-
52
-
53
-
54
-
55
-
56
-
57
-
58
-
59
-
60
-
61
-
62
-
63
-
64
-
65
-
66
-
67
-
68
-
 69
69 -
 70
70 -
 71
71 -
 72
72 -
 73
73 -
 74
74 -
 75
75 -
 76
76 -
 77
77 -
 78
78 -
 79
79 -
 80
80 -
 81
81 -
 82
82 -
 83
83 -
 84
84 -
 85
85 -
 86
86 -
 87
87 -
 88
88 -
 89
89 -
90
-
91
-
92
-
93
-
94
-
95
-
96
-
97
-
98
-
99
-
100
-
101
-
102
-
103
-
104
-
105
-
106
-
107
-
108
-
109
-
110
-
111
-
112
-
113
-
114
-
115
-
116
-
117
-
118
-
119
-
120
-
121
-
122
-
123
-
124
-
125
-
126
-
127
-
128
-
129
-
130
-
131
-
132
-
133
-
134
-
135
-
136
-
137
-
138
-
139
-
140
-
141
-
142
-
143
-
144
-
145
-
146
-
147
-
148
-
149
-
150
-
151
-
152
-
153
-
154
-
155
-
156
-
157
-
158
-
159
-
160
-
161
-
162
-
163
-
164
-
165
-
166
-
167
-
168
-
169
-
170
-
171
-
172
-
173
-
174
-
175
-
176
-
177
-
178
-
179
-
180
-
181
-
182
-
183
-
184
-
185
-
186
-
187
-
188
-
189
-
190
-
191
-
192
-
193
-
194
-
195
-
196
-
197
-
198
-
199
-
200
-
201
-
202
-
203
-
204
-
205
-
206
-
207
-
208
-
209
-
210
-
211
-
212
-
213
-
214
-
215
-
216
-
217
-
218
-
219
-
220
-
221
-
222
-
223
-
224
-
225
-
226
-
227
-
228
-
229
-
230
-
231
-
232
-
233
-
234
-
235
-
236
-
237
-
238
-
239
-
240
-
241
-
242
-
243
-
244
-
245
-
246
-
247
-
248
-
249
-
250
-
251
-
252
-
253
-
254
-
255
-
256
-
257
-
258
-
259
-
260
-
261
-
262
-
263
-
264
-
265
-
266
-
267
-
268
-
269
-
270
-
271
-
272
-
273
-
274
-
275
-
276
-
277
-
278
-
279
-
280
-
281
-
282
-
283
-
284
-
285
-
286
-
287
-
288
-
289
-
290
-
291
-
292
-
293
-
294
-
295
-
296
-
297
-
298
-
299
-
300
 |
 |

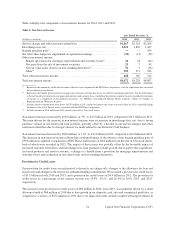
BUSINESS SEGMENT FINANCIAL PERFORMANCE
Our principal operations are currently organized into three major business segments, which are defined based on
the products and services provided or the type of customer served: Credit Card, Consumer Banking and Commercial
Banking. The operations of acquired businesses have been integrated into our existing business segments. Certain
activities that are not part of a segment, such as management of our corporate investment portfolio and asset/liability
management by our centralized Corporate Treasury group, are included in the Other category.
The results of our individual businesses, which we report on a continuing operations basis, reflect the manner in
which management evaluates performance and makes decisions about funding our operations and allocating
resources. We may periodically change our business segments or reclassify business segment results based on
modifications to our management reporting methodologies and changes in organizational alignment. Our business
segment results are intended to reflect each segment as if it were a stand-alone business. We use an internal
management and reporting process to derive our business segment results. Our internal management and reporting
process employs various allocation methodologies, including funds transfer pricing, to assign certain balance sheet
assets, deposits and other liabilities and their related revenue and expenses directly or indirectly attributable to each
business segment. Total interest income and net fees are directly attributable to the segment in which they are
reported. The net interest income of each segment reflects the results of our funds transfer pricing process, which is
primarily based on a matched maturity method that takes into consideration market rates. Our funds transfer pricing
process provides a funds credit for sources of funds, such as deposits generated by our Consumer Banking and
Commercial Banking businesses, and a funds charge for the use of funds by each segment. The allocation process
is unique to each business segment and acquired businesses. We regularly assess the assumptions, methodologies
and reporting classifications used for segment reporting, which may result in the implementation of refinements or
changes in future periods.
We refer to the business segment results derived from our internal management accounting and reporting process as
our “managed” presentation, which differs in some cases from our reported results prepared based on U.S. GAAP.
There is no comprehensive authoritative body of guidance for management accounting equivalent to U.S. GAAP;
therefore, the managed presentation of our business segment results may not be comparable to similar information
provided by other financial service companies. In addition, our individual business segment results should not be
used as a substitute for comparable results determined in accordance with U.S. GAAP.
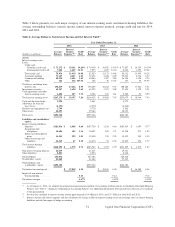
Below we summarize our business segment results for 2014, 2013 and 2012 and provide a comparative discussion
of these results. We also discuss changes in our financial condition and credit performance statistics as of
December 31, 2014 compared to December 31, 2013. We provide a reconciliation of our total business segment
results to our reported consolidated results in “Note 19—Business Segments.” Additionally, we provide information
on the outlook for each of our business segments as described above under “Executive Summary and Business
Outlook.”
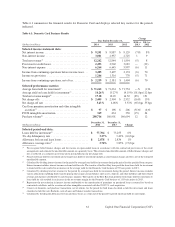
Credit Card Business
The primary sources of revenue for our Credit Card business are interest income, fees collected from customers and
interchange fees. Expenses primarily consist of the provision for credit losses, operating costs such as salaries and
associate benefits, occupancy and equipment, professional services, communications and data processing expenses
and marketing expenses. Rewards costs are generally netted against interchange fees.
Our Credit Card business generated net income from continuing operations of $2.5 billion, $2.6 billion and $1.5
billion in 2014, 2013 and 2012, respectively.
57 Capital One Financial Corporation (COF)