Capital One 2014 Annual Report Download - page 56
Download and view the complete annual report
Please find page 56 of the 2014 Capital One annual report below. You can navigate through the pages in the report by either clicking on the pages listed below, or by using the keyword search tool below to find specific information within the annual report.-
 1
1 -
2
-
3
-
4
-
5
-
6
-
7
-
8
-
9
-
10
-
11
-
12
-
13
-
14
-
15
-
16
-
17
-
18
-
19
-
20
-
21
-
22
-
23
-
24
-
25
-
26
-
27
-
28
-
29
-
30
-
31
-
32
-
33
-
34
-
35
-
36
-
37
-
38
-
39
-
40
-
41
-
42
-
43
-
44
-
45
-
 46
46 -
 47
47 -
 48
48 -
 49
49 -
 50
50 -
 51
51 -
 52
52 -
 53
53 -
 54
54 -
 55
55 -
 56
56 -
 57
57 -
 58
58 -
 59
59 -
 60
60 -
 61
61 -
 62
62 -
 63
63 -
 64
64 -
 65
65 -
 66
66 -
67
-
68
-
69
-
70
-
71
-
72
-
73
-
74
-
75
-
76
-
77
-
78
-
79
-
80
-
81
-
82
-
83
-
84
-
85
-
86
-
87
-
88
-
89
-
90
-
91
-
92
-
93
-
94
-
95
-
96
-
97
-
98
-
99
-
100
-
101
-
102
-
103
-
104
-
105
-
106
-
107
-
108
-
109
-
110
-
111
-
112
-
113
-
114
-
115
-
116
-
117
-
118
-
119
-
120
-
121
-
122
-
123
-
124
-
125
-
126
-
127
-
128
-
129
-
130
-
131
-
132
-
133
-
134
-
135
-
136
-
137
-
138
-
139
-
140
-
141
-
142
-
143
-
144
-
145
-
146
-
147
-
148
-
149
-
150
-
151
-
152
-
153
-
154
-
155
-
156
-
157
-
158
-
159
-
160
-
161
-
162
-
163
-
164
-
165
-
166
-
167
-
168
-
169
-
170
-
171
-
172
-
173
-
174
-
175
-
176
-
177
-
178
-
179
-
180
-
181
-
182
-
183
-
184
-
185
-
186
-
187
-
188
-
189
-
190
-
191
-
192
-
193
-
194
-
195
-
196
-
197
-
198
-
199
-
200
-
201
-
202
-
203
-
204
-
205
-
206
-
207
-
208
-
209
-
210
-
211
-
212
-
213
-
214
-
215
-
216
-
217
-
218
-
219
-
220
-
221
-
222
-
223
-
224
-
225
-
226
-
227
-
228
-
229
-
230
-
231
-
232
-
233
-
234
-
235
-
236
-
237
-
238
-
239
-
240
-
241
-
242
-
243
-
244
-
245
-
246
-
247
-
248
-
249
-
250
-
251
-
252
-
253
-
254
-
255
-
256
-
257
-
258
-
259
-
260
-
261
-
262
-
263
-
264
-
265
-
266
-
267
-
268
-
269
-
270
-
271
-
272
-
273
-
274
-
275
-
276
-
277
-
278
-
279
-
280
-
281
-
282
-
283
-
284
-
285
-
286
-
287
-
288
-
289
-
290
-
291
-
292
-
293
-
294
-
295
-
296
-
297
-
298
-
299
-
300
 |
 |
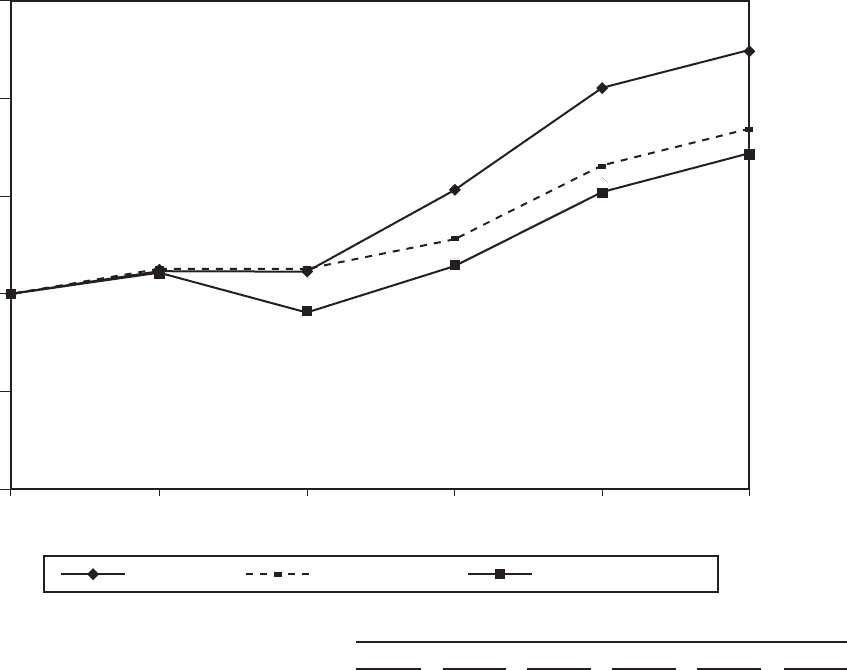
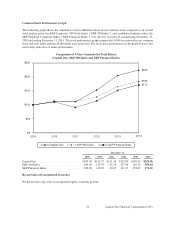
Common Stock Performance Graph
The following graph shows the cumulative total stockholder return on our common stock compared to an overall
stock market index, the S&P Composite 500 Stock Index (“S&P 500 Index”), and a published industry index, the
S&P Financial Composite Index (“S&P Financial Index”), over the five-year period commencing December 31,
2009 and ending December 31, 2014. The stock performance graph assumes that $100 was invested in our common
stock and each index and that all dividends were reinvested. The stock price performance on the graph below is not
necessarily indicative of future performance.
December 31,
2009 2010 2011 2012 2013 2014
Capital One . . . . . . . . . . . . . . . . . . . . . . . . . . . . . . $100.00 $111.57 $111.34 $153.09 $205.43 $224.86
S&P 500 Index . . . . . . . . . . . . . . . . . . . . . . . . . . . 100.00 112.78 112.78 127.90 165.76 184.64
S&P Financial Index . . . . . . . . . . . . . . . . . . . . . . . 100.00 110.83 90.43 114.17 152.09 172.01
Recent Sales of Unregistered Securities
We did not have any sales of unregistered equity securities in 2014.
$225
$185
$172
$250
$200
$150
$100
$50
$0
Comparison of 5-Year Cummulative Total Return
(Capital One, S&P 500 Index and S&P Financial Index)
2009 2010 2011 2012 2013 2014
Capital One S&P 500 Index S&P Financial Index
34 Capital One Financial Corporation (COF)