Capital One 2014 Annual Report Download - page 182
Download and view the complete annual report
Please find page 182 of the 2014 Capital One annual report below. You can navigate through the pages in the report by either clicking on the pages listed below, or by using the keyword search tool below to find specific information within the annual report.-
 1
1 -
2
-
3
-
4
-
5
-
6
-
7
-
8
-
9
-
10
-
11
-
12
-
13
-
14
-
15
-
16
-
17
-
18
-
19
-
20
-
21
-
22
-
23
-
24
-
25
-
26
-
27
-
28
-
29
-
30
-
31
-
32
-
33
-
34
-
35
-
36
-
37
-
38
-
39
-
40
-
41
-
42
-
43
-
44
-
45
-
46
-
47
-
48
-
49
-
50
-
51
-
52
-
53
-
54
-
55
-
56
-
57
-
58
-
59
-
60
-
61
-
62
-
63
-
64
-
65
-
66
-
67
-
68
-
69
-
70
-
71
-
72
-
73
-
74
-
75
-
76
-
77
-
78
-
79
-
80
-
81
-
82
-
83
-
84
-
85
-
86
-
87
-
88
-
89
-
90
-
91
-
92
-
93
-
94
-
95
-
96
-
97
-
98
-
99
-
100
-
101
-
102
-
103
-
104
-
105
-
106
-
107
-
108
-
109
-
110
-
111
-
112
-
113
-
114
-
115
-
116
-
117
-
118
-
119
-
120
-
121
-
122
-
123
-
124
-
125
-
126
-
127
-
128
-
129
-
130
-
131
-
132
-
133
-
134
-
135
-
136
-
137
-
138
-
139
-
140
-
141
-
142
-
143
-
144
-
145
-
146
-
147
-
148
-
149
-
150
-
151
-
152
-
153
-
154
-
155
-
156
-
157
-
158
-
159
-
160
-
161
-
162
-
163
-
164
-
165
-
166
-
167
-
168
-
169
-
170
-
171
-
 172
172 -
 173
173 -
 174
174 -
 175
175 -
 176
176 -
 177
177 -
 178
178 -
 179
179 -
 180
180 -
 181
181 -
 182
182 -
 183
183 -
 184
184 -
 185
185 -
 186
186 -
 187
187 -
 188
188 -
 189
189 -
 190
190 -
 191
191 -
 192
192 -
193
-
194
-
195
-
196
-
197
-
198
-
199
-
200
-
201
-
202
-
203
-
204
-
205
-
206
-
207
-
208
-
209
-
210
-
211
-
212
-
213
-
214
-
215
-
216
-
217
-
218
-
219
-
220
-
221
-
222
-
223
-
224
-
225
-
226
-
227
-
228
-
229
-
230
-
231
-
232
-
233
-
234
-
235
-
236
-
237
-
238
-
239
-
240
-
241
-
242
-
243
-
244
-
245
-
246
-
247
-
248
-
249
-
250
-
251
-
252
-
253
-
254
-
255
-
256
-
257
-
258
-
259
-
260
-
261
-
262
-
263
-
264
-
265
-
266
-
267
-
268
-
269
-
270
-
271
-
272
-
273
-
274
-
275
-
276
-
277
-
278
-
279
-
280
-
281
-
282
-
283
-
284
-
285
-
286
-
287
-
288
-
289
-
290
-
291
-
292
-
293
-
294
-
295
-
296
-
297
-
298
-
299
-
300
 |
 |

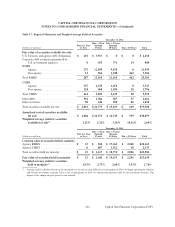
160
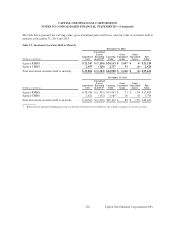
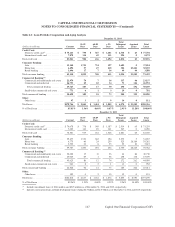
December 31, 2013
Less than 12 Months 12 Months or Longer Total
Gross Gross Gross
Unrealized Unrealized Unrealized
(Dollars in millions) Fair Value Losses Fair Value Losses Fair Value Losses
Investment securities available for sale:
Corporate debt securities guaranteed by
U.S. government agencies . . . . . . . . . . $ 1,143 $ (47) $ 46 $ (2) $ 1,189 $ (49)
RMBS:
Agency . . . . . . . . . . . . . . . . . . . . . . . . . 9,769 (263) 1,770 (69) 11,539 (332)
Non-agency . . . . . . . . . . . . . . . . . . . . . 454 (10) 56 (5) 510 (15)
Total RMBS . . . . . . . . . . . . . . . . . . . . . . . . . 10,223 (273) 1,826 (74) 12,049 (347)
CMBS:
Agency . . . . . . . . . . . . . . . . . . . . . . . . . 2,842 (74) 256 (10) 3,098 (84)
Non-agency . . . . . . . . . . . . . . . . . . . . . 952 (43) 183 (17) 1,135 (60)
Total CMBS . . . . . . . . . . . . . . . . . . . . . . . . . 3,794 (117) 439 (27) 4,233 (144)
Other ABS . . . . . . . . . . . . . . . . . . . . . . . . . . 2,528 (34) 392 (2) 2,920 (36)
Other securities . . . . . . . . . . . . . . . . . . . . . . 1,149 (51) 57 (4) 1,206 (55)
Total investment securities available for
sale in a gross unrealized loss position . . $ 18,837 $ (522) $ 2,760 $ (109) $ 21,597 $ (631)
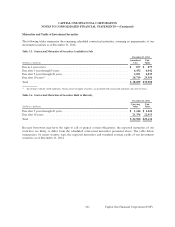
As of December 31, 2014, the amortized cost of approximately 500 securities available for sale exceeded their fair
value by $237 million, of which $206 million related to investment securities that had been in a loss position for 12
months or longer. As of December 31, 2014, our investments in non-agency RMBS and CMBS, other ABS, and
other securities accounted for $51 million, or 21%, of total gross unrealized losses on securities available for sale.
As of December 31, 2014, the carrying value of approximately 20 securities classified as held to maturity exceeded
their fair value by $6 million.
Gross unrealized losses on our investment securities have generally decreased since December 31, 2013. The
unrealized losses related to investment securities for which we have not recognized credit impairment are primarily
attributable to changes in market interest rates. As discussed in more detail below, we conduct periodic reviews of all
investment securities with unrealized losses to assess whether impairment is other-than-temporary. We believe the
securities with an unrealized loss in AOCI are not other-than-temporarily impaired as of December 31, 2014.
CAPITAL ONE FINANCIAL CORPORATION
NOTES TO CONSOLIDATED FINANCIAL STATEMENTS—(Continued)
Capital One Financial Corporation (COF)