Capital One 2014 Annual Report Download - page 207
Download and view the complete annual report
Please find page 207 of the 2014 Capital One annual report below. You can navigate through the pages in the report by either clicking on the pages listed below, or by using the keyword search tool below to find specific information within the annual report.-
 1
1 -
2
-
3
-
4
-
5
-
6
-
7
-
8
-
9
-
10
-
11
-
12
-
13
-
14
-
15
-
16
-
17
-
18
-
19
-
20
-
21
-
22
-
23
-
24
-
25
-
26
-
27
-
28
-
29
-
30
-
31
-
32
-
33
-
34
-
35
-
36
-
37
-
38
-
39
-
40
-
41
-
42
-
43
-
44
-
45
-
46
-
47
-
48
-
49
-
50
-
51
-
52
-
53
-
54
-
55
-
56
-
57
-
58
-
59
-
60
-
61
-
62
-
63
-
64
-
65
-
66
-
67
-
68
-
69
-
70
-
71
-
72
-
73
-
74
-
75
-
76
-
77
-
78
-
79
-
80
-
81
-
82
-
83
-
84
-
85
-
86
-
87
-
88
-
89
-
90
-
91
-
92
-
93
-
94
-
95
-
96
-
97
-
98
-
99
-
100
-
101
-
102
-
103
-
104
-
105
-
106
-
107
-
108
-
109
-
110
-
111
-
112
-
113
-
114
-
115
-
116
-
117
-
118
-
119
-
120
-
121
-
122
-
123
-
124
-
125
-
126
-
127
-
128
-
129
-
130
-
131
-
132
-
133
-
134
-
135
-
136
-
137
-
138
-
139
-
140
-
141
-
142
-
143
-
144
-
145
-
146
-
147
-
148
-
149
-
150
-
151
-
152
-
153
-
154
-
155
-
156
-
157
-
158
-
159
-
160
-
161
-
162
-
163
-
164
-
165
-
166
-
167
-
168
-
169
-
170
-
171
-
172
-
173
-
174
-
175
-
176
-
177
-
178
-
179
-
180
-
181
-
182
-
183
-
184
-
185
-
186
-
187
-
188
-
189
-
190
-
191
-
192
-
193
-
194
-
195
-
196
-
 197
197 -
 198
198 -
 199
199 -
 200
200 -
 201
201 -
 202
202 -
 203
203 -
 204
204 -
 205
205 -
 206
206 -
 207
207 -
 208
208 -
 209
209 -
 210
210 -
 211
211 -
 212
212 -
 213
213 -
 214
214 -
 215
215 -
 216
216 -
 217
217 -
218
-
219
-
220
-
221
-
222
-
223
-
224
-
225
-
226
-
227
-
228
-
229
-
230
-
231
-
232
-
233
-
234
-
235
-
236
-
237
-
238
-
239
-
240
-
241
-
242
-
243
-
244
-
245
-
246
-
247
-
248
-
249
-
250
-
251
-
252
-
253
-
254
-
255
-
256
-
257
-
258
-
259
-
260
-
261
-
262
-
263
-
264
-
265
-
266
-
267
-
268
-
269
-
270
-
271
-
272
-
273
-
274
-
275
-
276
-
277
-
278
-
279
-
280
-
281
-
282
-
283
-
284
-
285
-
286
-
287
-
288
-
289
-
290
-
291
-
292
-
293
-
294
-
295
-
296
-
297
-
298
-
299
-
300
 |
 |

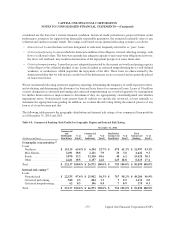
185
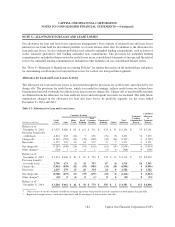
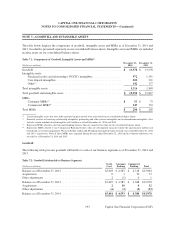
Components of Allowance for Loan and Lease Losses by Impairment Methodology
The table below presents the components of our allowance for loan and lease losses, by portfolio segment and
impairment methodology, and the recorded investment of the related loans as of December 31, 2014 and 2013:
Table 5.2: Components of Allowance for Loan and Lease Losses by Impairment Methodology
December 31, 2014
Consumer Banking
Total
Credit Home Retail Consumer Commercial
(Dollars in millions) Card Auto Loan Banking Banking Banking Other Total
Allowance for loan and lease losses
by impairment methodology:
Collectively evaluated(1) . . . . . . . . . $ 2,985 $ 642 $ 18 $ 50 $ 710 $ 356 $ 5 $ 4,056
Asset-specific(2) . . . . . . . . . . . . . . . . 219 19 17 6 42 39 0 300
Acquired Loans(3) . . . . . . . . . . . . . . 0 0 27 0 27 0 0 27
Total allowance for loan and
lease losses . . . . . . . . . . . . . . . . . . . $ 3,204 $ 661 $ 62 $ 56 $ 779 $ 395 $ 5 $ 4,383
Loans held for investment by
impairment methodology:
Collectively evaluated(1) . . . . . . . . . $85,161 $37,594 $ 6,427 $3,486 $47,507 $50,328 $111 $183,107
Asset-specific(2) . . . . . . . . . . . . . . . . 692 230 367 50 647 370 0 1,709
Acquired Loans(3) . . . . . . . . . . . . . . 23 0 23,241 44 23,285 192 0 23,500
Total loans held for investment . . . . $85,876 $37,824 $30,035 $3,580 $71,439 $50,890 $111 $208,316
Allowance as a percentage
of period-end loans held for
investment . . . . . . . . . . . . . . . . . . 3.73% 1.75% 0.21% 1.58% 1.09% 0.78% 4.68% 2.10%
CAPITAL ONE FINANCIAL CORPORATION
NOTES TO CONSOLIDATED FINANCIAL STATEMENTS—(Continued)
Capital One Financial Corporation (COF)