Capital One 2014 Annual Report Download - page 253
Download and view the complete annual report
Please find page 253 of the 2014 Capital One annual report below. You can navigate through the pages in the report by either clicking on the pages listed below, or by using the keyword search tool below to find specific information within the annual report.-
 1
1 -
2
-
3
-
4
-
5
-
6
-
7
-
8
-
9
-
10
-
11
-
12
-
13
-
14
-
15
-
16
-
17
-
18
-
19
-
20
-
21
-
22
-
23
-
24
-
25
-
26
-
27
-
28
-
29
-
30
-
31
-
32
-
33
-
34
-
35
-
36
-
37
-
38
-
39
-
40
-
41
-
42
-
43
-
44
-
45
-
46
-
47
-
48
-
49
-
50
-
51
-
52
-
53
-
54
-
55
-
56
-
57
-
58
-
59
-
60
-
61
-
62
-
63
-
64
-
65
-
66
-
67
-
68
-
69
-
70
-
71
-
72
-
73
-
74
-
75
-
76
-
77
-
78
-
79
-
80
-
81
-
82
-
83
-
84
-
85
-
86
-
87
-
88
-
89
-
90
-
91
-
92
-
93
-
94
-
95
-
96
-
97
-
98
-
99
-
100
-
101
-
102
-
103
-
104
-
105
-
106
-
107
-
108
-
109
-
110
-
111
-
112
-
113
-
114
-
115
-
116
-
117
-
118
-
119
-
120
-
121
-
122
-
123
-
124
-
125
-
126
-
127
-
128
-
129
-
130
-
131
-
132
-
133
-
134
-
135
-
136
-
137
-
138
-
139
-
140
-
141
-
142
-
143
-
144
-
145
-
146
-
147
-
148
-
149
-
150
-
151
-
152
-
153
-
154
-
155
-
156
-
157
-
158
-
159
-
160
-
161
-
162
-
163
-
164
-
165
-
166
-
167
-
168
-
169
-
170
-
171
-
172
-
173
-
174
-
175
-
176
-
177
-
178
-
179
-
180
-
181
-
182
-
183
-
184
-
185
-
186
-
187
-
188
-
189
-
190
-
191
-
192
-
193
-
194
-
195
-
196
-
197
-
198
-
199
-
200
-
201
-
202
-
203
-
204
-
205
-
206
-
207
-
208
-
209
-
210
-
211
-
212
-
213
-
214
-
215
-
216
-
217
-
218
-
219
-
220
-
221
-
222
-
223
-
224
-
225
-
226
-
227
-
228
-
229
-
230
-
231
-
232
-
233
-
234
-
235
-
236
-
237
-
238
-
239
-
240
-
241
-
242
-
 243
243 -
 244
244 -
 245
245 -
 246
246 -
 247
247 -
 248
248 -
 249
249 -
 250
250 -
 251
251 -
 252
252 -
 253
253 -
 254
254 -
 255
255 -
 256
256 -
 257
257 -
 258
258 -
 259
259 -
 260
260 -
 261
261 -
 262
262 -
 263
263 -
264
-
265
-
266
-
267
-
268
-
269
-
270
-
271
-
272
-
273
-
274
-
275
-
276
-
277
-
278
-
279
-
280
-
281
-
282
-
283
-
284
-
285
-
286
-
287
-
288
-
289
-
290
-
291
-
292
-
293
-
294
-
295
-
296
-
297
-
298
-
299
-
300
 |
 |

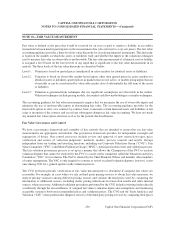
to those from other sources and reviewing other control documentation. Additionally, when necessary, the CVG and
TAV challenge prices from third-party vendors to ensure reasonableness of prices through a pricing challenge process.
This may include a request for transparency of the assumptions used by the third party.
The FVC, which includes representation from our Risk Management and Finance divisions, is a forum for discussing
fair market valuations, inputs, assumptions, methodologies, variance thresholds, valuation control environments and
material risks or concerns related to fair market valuations. Additionally, the FVC is empowered to resolve valuation
disputes between the primary valuation providers and the CVG, and provides guidance and oversight to ensure an
appropriate valuation control environment. The FVC regularly reviews and approves our valuation methodologies to
ensure that our methodologies and practices are consistent with industry standards and adhere to regulatory and
accounting guidance. The Chief Financial Officer determines when material issues or concerns regarding valuations
shall be raised to the Audit Committee or another delegated committee of the Board of Directors.
We have a model policy, established by an independent Model Risk Office, which governs the validation of models
and related supporting documentation to ensure the appropriate use of models for pricing. The MVG is part of the
Model Risk Office and validates all models and provides ongoing monitoring of their performance, including the
validation and monitoring of the performance of all valuation models.
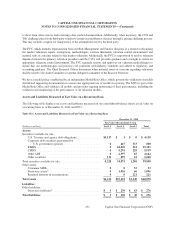
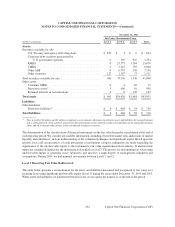
Assets and Liabilities Measured at Fair Value on a Recurring Basis
The following table displays our assets and liabilities measured on our consolidated balance sheets at fair value on
a recurring basis as of December 31, 2014 and 2013:
Table 18.1: Assets and Liabilities Measured at Fair Value on a Recurring Basis
December 31, 2014
Fair Value Measurements Using
(Dollars in millions) Level 1 Level 2 Level 3 Total
Assets:
Securities available for sale:
U.S. Treasury and agency debt obligations . . . . . . . . . . . . . . . . . $4,117 $ 1 $ 0 $ 4,118
Corporate debt securities guaranteed by
U.S. government agencies . . . . . . . . . . . . . . . . . . . . . . . . . . 0 467 333 800
RMBS . . . . . . . . . . . . . . . . . . . . . . . . . . . . . . . . . . . . . . . . . . . . . 0 24,820 561 25,381
CMBS . . . . . . . . . . . . . . . . . . . . . . . . . . . . . . . . . . . . . . . . . . . . . 0 5,291 228 5,519
Other ABS . . . . . . . . . . . . . . . . . . . . . . . . . . . . . . . . . . . . . . . . . . 0 2,597 65 2,662
Other securities . . . . . . . . . . . . . . . . . . . . . . . . . . . . . . . . . . . . . . 111 899 18 1,028
Total securities available for sale . . . . . . . . . . . . . . . . . . . . . . . . . . . . 4,228 34,075 1,205 39,508
Other assets:
Consumer MSRs . . . . . . . . . . . . . . . . . . . . . . . . . . . . . . . . . . . . . 0 0 53 53
Derivative assets(1) . . . . . . . . . . . . . . . . . . . . . . . . . . . . . . . . . . . . 4 1,026 66 1,096
Retained interests in securitizations . . . . . . . . . . . . . . . . . . . . . . 0 0 221 221
Total assets . . . . . . . . . . . . . . . . . . . . . . . . . . . . . . . . . . . . . . . . . . . . . $4,232 $35,101 $1,545 $40,878
Liabilities:
Other liabilities:
Derivative liabilities(1) . . . . . . . . . . . . . . . . . . . . . . . . . . . . . . . . . $ 3 $ 230 $ 43 $ 276
Total liabilities . . . . . . . . . . . . . . . . . . . . . . . . . . . . . . . . . . . . . . . . . . $ 3 $ 230 $ 43 $ 276
231
CAPITAL ONE FINANCIAL CORPORATION
NOTES TO CONSOLIDATED FINANCIAL STATEMENTS—(Continued)
Capital One Financial Corporation (COF)