Capital One 2014 Annual Report Download - page 239
Download and view the complete annual report
Please find page 239 of the 2014 Capital One annual report below. You can navigate through the pages in the report by either clicking on the pages listed below, or by using the keyword search tool below to find specific information within the annual report.-
 1
1 -
2
-
3
-
4
-
5
-
6
-
7
-
8
-
9
-
10
-
11
-
12
-
13
-
14
-
15
-
16
-
17
-
18
-
19
-
20
-
21
-
22
-
23
-
24
-
25
-
26
-
27
-
28
-
29
-
30
-
31
-
32
-
33
-
34
-
35
-
36
-
37
-
38
-
39
-
40
-
41
-
42
-
43
-
44
-
45
-
46
-
47
-
48
-
49
-
50
-
51
-
52
-
53
-
54
-
55
-
56
-
57
-
58
-
59
-
60
-
61
-
62
-
63
-
64
-
65
-
66
-
67
-
68
-
69
-
70
-
71
-
72
-
73
-
74
-
75
-
76
-
77
-
78
-
79
-
80
-
81
-
82
-
83
-
84
-
85
-
86
-
87
-
88
-
89
-
90
-
91
-
92
-
93
-
94
-
95
-
96
-
97
-
98
-
99
-
100
-
101
-
102
-
103
-
104
-
105
-
106
-
107
-
108
-
109
-
110
-
111
-
112
-
113
-
114
-
115
-
116
-
117
-
118
-
119
-
120
-
121
-
122
-
123
-
124
-
125
-
126
-
127
-
128
-
129
-
130
-
131
-
132
-
133
-
134
-
135
-
136
-
137
-
138
-
139
-
140
-
141
-
142
-
143
-
144
-
145
-
146
-
147
-
148
-
149
-
150
-
151
-
152
-
153
-
154
-
155
-
156
-
157
-
158
-
159
-
160
-
161
-
162
-
163
-
164
-
165
-
166
-
167
-
168
-
169
-
170
-
171
-
172
-
173
-
174
-
175
-
176
-
177
-
178
-
179
-
180
-
181
-
182
-
183
-
184
-
185
-
186
-
187
-
188
-
189
-
190
-
191
-
192
-
193
-
194
-
195
-
196
-
197
-
198
-
199
-
200
-
201
-
202
-
203
-
204
-
205
-
206
-
207
-
208
-
209
-
210
-
211
-
212
-
213
-
214
-
215
-
216
-
217
-
218
-
219
-
220
-
221
-
222
-
223
-
224
-
225
-
226
-
227
-
228
-
 229
229 -
 230
230 -
 231
231 -
 232
232 -
 233
233 -
 234
234 -
 235
235 -
 236
236 -
 237
237 -
 238
238 -
 239
239 -
 240
240 -
 241
241 -
 242
242 -
 243
243 -
 244
244 -
 245
245 -
 246
246 -
 247
247 -
 248
248 -
 249
249 -
250
-
251
-
252
-
253
-
254
-
255
-
256
-
257
-
258
-
259
-
260
-
261
-
262
-
263
-
264
-
265
-
266
-
267
-
268
-
269
-
270
-
271
-
272
-
273
-
274
-
275
-
276
-
277
-
278
-
279
-
280
-
281
-
282
-
283
-
284
-
285
-
286
-
287
-
288
-
289
-
290
-
291
-
292
-
293
-
294
-
295
-
296
-
297
-
298
-
299
-
300
 |
 |

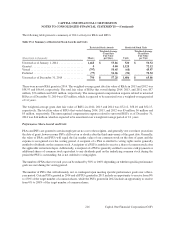
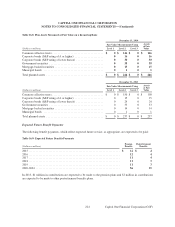
The following table presents a summary of 2014 activity for PSAs and PSUs.
Table 15.5: Summary of Performance Share Awards and Units
Performance Share Awards Performance Share Units
Weighted-Average Weighted-Average
Grant Date Grant Date
Fair Value Fair Value
(Shares/units in thousands) Shares per Share Units per Unit
Unvested as of January 1, 2014 . . . . . . . . . . . . . . . . . . . 1,139 $ 51.87 864 $ 50.21
Granted(1) . . . . . . . . . . . . . . . . . . . . . . . . . . . . . . . . . . . . 22 70.96 1,096 68.66
Vested(1) . . . . . . . . . . . . . . . . . . . . . . . . . . . . . . . . . . . . . (462) 50.82 (289) 48.33
Forfeited . . . . . . . . . . . . . . . . . . . . . . . . . . . . . . . . . . . . . (111) 52.28 (147) 66.70
Unvested as of December 31, 2014 . . . . . . . . . . . . . . . . 588 $ 53.33 1,524 $ 62.25
(1) Includes adjustments for achievement of specific performance goals for performance share units granted in prior periods.
The weighted-average grant date fair value of PSAs granted during 2014, 2013 and 2012 was $70.96, $56.32 and
$45.91, respectively. The total fair value of PSAs that vested during 2014 and 2013 was $33 million and $16 million,
respectively. The unrecognized compensation expense related to unvested PSAs as of December 31, 2014 was $4
million, which is expected to be amortized over a weighted-average period of 0.5 years.
The weighted-average grant date fair value of PSUs granted during 2014, 2013 and 2012 was $68.66, $52.05 and
$39.07, respectively. The total fair value of performance share units that vested on the vesting date was $20 million,
$10 million and $21 million in 2014, 2013 and 2012, respectively. The unrecognized compensation expense related
to unvested performance share units as of December 31, 2014 was $26 million, which is expected to be amortized
over a weighted-average period of 1.1 years.
Cash-Settled Units
Cash-settled units are recorded as liabilities and marked-to-market on a quarterly basis. Cash-settled units are settled
with a cash payment for each unit vested that is equal to the average fair market value of our common stock for the 15
or 20 trading days preceding the vesting date. Cash-settled units generally vest over three years beginning on the
first anniversary of the date of grant, however some cash-settled units cliff vest shortly before the one year anniversary
of the grant date or on or shortly after the third anniversary of the grant date. Cash-settled units vesting during 2014,
2013 and 2012 resulted in cash payments to associates of $72 million, $74 million, and $88 million, respectively. We
expect to recognize the unrecognized compensation cost for unvested cash-settled units of $14 million, as of
December 31, 2014, based on the closing price of our common stock as of that date, over a weighted-average period
of 0.8 years.
Associate Stock Purchase Plan
We maintain an Associate Stock Purchase Plan (the “Purchase Plan”) which is a compensatory plan under the
accounting guidance for stock-based compensation. We recognized $13 million, $11 million and $8 million in
compensation expense for 2014, 2013 and 2012, respectively, under the Purchase Plan.
Under the Purchase Plan, eligible associates are permitted to contribute between 1% and 15% of their base salary
through payroll deductions. The amounts contributed are applied to the purchase of our unissued common or treasury
stock at 85% of the current market price. Shares may also be acquired on the open market. Dividends for active
217
CAPITAL ONE FINANCIAL CORPORATION
NOTES TO CONSOLIDATED FINANCIAL STATEMENTS—(Continued)
Capital One Financial Corporation (COF)