Capital One 2014 Annual Report Download - page 84
Download and view the complete annual report
Please find page 84 of the 2014 Capital One annual report below. You can navigate through the pages in the report by either clicking on the pages listed below, or by using the keyword search tool below to find specific information within the annual report.-
 1
1 -
2
-
3
-
4
-
5
-
6
-
7
-
8
-
9
-
10
-
11
-
12
-
13
-
14
-
15
-
16
-
17
-
18
-
19
-
20
-
21
-
22
-
23
-
24
-
25
-
26
-
27
-
28
-
29
-
30
-
31
-
32
-
33
-
34
-
35
-
36
-
37
-
38
-
39
-
40
-
41
-
42
-
43
-
44
-
45
-
46
-
47
-
48
-
49
-
50
-
51
-
52
-
53
-
54
-
55
-
56
-
57
-
58
-
59
-
60
-
61
-
62
-
63
-
64
-
65
-
66
-
67
-
68
-
69
-
70
-
71
-
72
-
73
-
 74
74 -
 75
75 -
 76
76 -
 77
77 -
 78
78 -
 79
79 -
 80
80 -
 81
81 -
 82
82 -
 83
83 -
 84
84 -
 85
85 -
 86
86 -
 87
87 -
 88
88 -
 89
89 -
 90
90 -
 91
91 -
 92
92 -
 93
93 -
 94
94 -
95
-
96
-
97
-
98
-
99
-
100
-
101
-
102
-
103
-
104
-
105
-
106
-
107
-
108
-
109
-
110
-
111
-
112
-
113
-
114
-
115
-
116
-
117
-
118
-
119
-
120
-
121
-
122
-
123
-
124
-
125
-
126
-
127
-
128
-
129
-
130
-
131
-
132
-
133
-
134
-
135
-
136
-
137
-
138
-
139
-
140
-
141
-
142
-
143
-
144
-
145
-
146
-
147
-
148
-
149
-
150
-
151
-
152
-
153
-
154
-
155
-
156
-
157
-
158
-
159
-
160
-
161
-
162
-
163
-
164
-
165
-
166
-
167
-
168
-
169
-
170
-
171
-
172
-
173
-
174
-
175
-
176
-
177
-
178
-
179
-
180
-
181
-
182
-
183
-
184
-
185
-
186
-
187
-
188
-
189
-
190
-
191
-
192
-
193
-
194
-
195
-
196
-
197
-
198
-
199
-
200
-
201
-
202
-
203
-
204
-
205
-
206
-
207
-
208
-
209
-
210
-
211
-
212
-
213
-
214
-
215
-
216
-
217
-
218
-
219
-
220
-
221
-
222
-
223
-
224
-
225
-
226
-
227
-
228
-
229
-
230
-
231
-
232
-
233
-
234
-
235
-
236
-
237
-
238
-
239
-
240
-
241
-
242
-
243
-
244
-
245
-
246
-
247
-
248
-
249
-
250
-
251
-
252
-
253
-
254
-
255
-
256
-
257
-
258
-
259
-
260
-
261
-
262
-
263
-
264
-
265
-
266
-
267
-
268
-
269
-
270
-
271
-
272
-
273
-
274
-
275
-
276
-
277
-
278
-
279
-
280
-
281
-
282
-
283
-
284
-
285
-
286
-
287
-
288
-
289
-
290
-
291
-
292
-
293
-
294
-
295
-
296
-
297
-
298
-
299
-
300
 |
 |
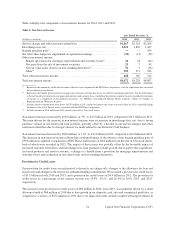
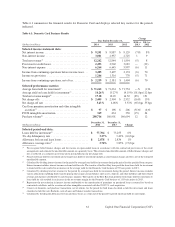
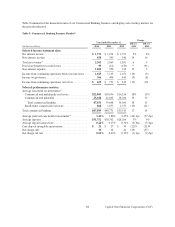
Because our Domestic Card business accounts for the substantial majority of our Credit Card business, the key
factors driving the results discussed above are similar to the key factors affecting our total Credit Card business.
The primary driver of the decline in net income for our Domestic Card business in 2014, compared to 2013, was a
decrease in revenue primarily driven by the Portfolio Sale and higher marketing expenses, partially offset by lower
acquisition-related costs and provision for litigation matters, as well as lower operating expenses attributable to the
Portfolio Sale in 2013 and operating efficiencies.
The primary drivers of the improvement in results for our Domestic Card business in 2013, compared to 2012,
included: (i) higher interest income primarily driven by a higher average yield on loans held for investment driven
largely by the transfer of the Best Buy loan portfolio to the held for sale category in the first quarter of 2013, as well
as the absence of the charge recorded in the second quarter of 2012 to establish the finance charge and fee reserve
for the acquired credit card loans; (ii) the increase in interest and non-interest income in 2013 due to the full year
impact of 2012 U.S. card acquisition; and (iii) the absence of the provision for credit losses of $1.2 billion recorded
in the second quarter of 2012 to establish an allowance for acquired credit card loans. These impacts were partially
offset by higher operating expenses attributable to the addition of loans and increased amortization of intangibles
and other assets associated with the 2012 U.S. card acquisition.
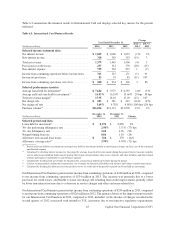
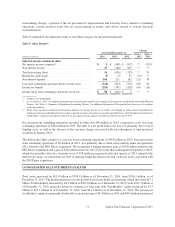
International Card Business
International Card generated net income from continuing operations of $240 million, $234 million and $126 million
in 2014, 2013 and 2012, respectively. International Card accounted for 10% of total net revenues in 2014, compared
to 10% and 11% in 2013 and 2012, respectively, for our Credit Card business. Income attributable to International
Card represented 10% of net income for our Credit Card business in 2014, compared to 9% and 8% of net income
for 2013 and 2012, respectively.
62 Capital One Financial Corporation (COF)