Capital One 2014 Annual Report Download - page 80
Download and view the complete annual report
Please find page 80 of the 2014 Capital One annual report below. You can navigate through the pages in the report by either clicking on the pages listed below, or by using the keyword search tool below to find specific information within the annual report.-
 1
1 -
2
-
3
-
4
-
5
-
6
-
7
-
8
-
9
-
10
-
11
-
12
-
13
-
14
-
15
-
16
-
17
-
18
-
19
-
20
-
21
-
22
-
23
-
24
-
25
-
26
-
27
-
28
-
29
-
30
-
31
-
32
-
33
-
34
-
35
-
36
-
37
-
38
-
39
-
40
-
41
-
42
-
43
-
44
-
45
-
46
-
47
-
48
-
49
-
50
-
51
-
52
-
53
-
54
-
55
-
56
-
57
-
58
-
59
-
60
-
61
-
62
-
63
-
64
-
65
-
66
-
67
-
68
-
69
-
 70
70 -
 71
71 -
 72
72 -
 73
73 -
 74
74 -
 75
75 -
 76
76 -
 77
77 -
 78
78 -
 79
79 -
 80
80 -
 81
81 -
 82
82 -
 83
83 -
 84
84 -
 85
85 -
 86
86 -
 87
87 -
 88
88 -
 89
89 -
 90
90 -
91
-
92
-
93
-
94
-
95
-
96
-
97
-
98
-
99
-
100
-
101
-
102
-
103
-
104
-
105
-
106
-
107
-
108
-
109
-
110
-
111
-
112
-
113
-
114
-
115
-
116
-
117
-
118
-
119
-
120
-
121
-
122
-
123
-
124
-
125
-
126
-
127
-
128
-
129
-
130
-
131
-
132
-
133
-
134
-
135
-
136
-
137
-
138
-
139
-
140
-
141
-
142
-
143
-
144
-
145
-
146
-
147
-
148
-
149
-
150
-
151
-
152
-
153
-
154
-
155
-
156
-
157
-
158
-
159
-
160
-
161
-
162
-
163
-
164
-
165
-
166
-
167
-
168
-
169
-
170
-
171
-
172
-
173
-
174
-
175
-
176
-
177
-
178
-
179
-
180
-
181
-
182
-
183
-
184
-
185
-
186
-
187
-
188
-
189
-
190
-
191
-
192
-
193
-
194
-
195
-
196
-
197
-
198
-
199
-
200
-
201
-
202
-
203
-
204
-
205
-
206
-
207
-
208
-
209
-
210
-
211
-
212
-
213
-
214
-
215
-
216
-
217
-
218
-
219
-
220
-
221
-
222
-
223
-
224
-
225
-
226
-
227
-
228
-
229
-
230
-
231
-
232
-
233
-
234
-
235
-
236
-
237
-
238
-
239
-
240
-
241
-
242
-
243
-
244
-
245
-
246
-
247
-
248
-
249
-
250
-
251
-
252
-
253
-
254
-
255
-
256
-
257
-
258
-
259
-
260
-
261
-
262
-
263
-
264
-
265
-
266
-
267
-
268
-
269
-
270
-
271
-
272
-
273
-
274
-
275
-
276
-
277
-
278
-
279
-
280
-
281
-
282
-
283
-
284
-
285
-
286
-
287
-
288
-
289
-
290
-
291
-
292
-
293
-
294
-
295
-
296
-
297
-
298
-
299
-
300
 |
 |

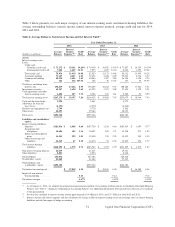
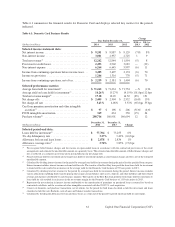
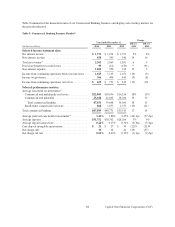
Table 6 summarizes the financial results of our Credit Card business, which is comprised of Domestic Card and
International Card, and displays selected key metrics for the periods indicated.
Table 6: Credit Card Business Results
Change
Year Ended December 31, 2014 vs. 2013 vs.
(Dollars in millions) 2014 2013 2012 2013 2012
Selected income statement data:
Net interest income . . . . . . . . . . . . . . . . . . . . . . . . . . . . . . . . $ 10,310 $ 10,967 $ 10,182 (6)% 8%
Non-interest income . . . . . . . . . . . . . . . . . . . . . . . . . . . . . . . 3,311 3,320 3,078 — 8
Total net revenue
(1)
. . . . . . . . . . . . . . . . . . . . . . . . . . . . . . . . 13,621 14,287 13,260 (5) 8
Provision for credit losses . . . . . . . . . . . . . . . . . . . . . . . . . . . 2,750 2,824 4,061 (3) (30)
Non-interest expense . . . . . . . . . . . . . . . . . . . . . . . . . . . . . . 7,063 7,439 6,854 (5) 9
Income from continuing operations before income taxes . . . 3,808 4,024 2,345 (5) 72
Income tax provision . . . . . . . . . . . . . . . . . . . . . . . . . . . . . . 1,329 1,409 815 (6) 73
Income from continuing operations, net of tax . . . . . . . . . . . $ 2,479 $ 2,615 $ 1,530 (5) 71
Selected performance metrics:
Average loans held for investment
(2) . . . . . . . . . . . . . . . . . .
$ 78,946 $ 79,207 $ 80,009 —% (1)%
Average yield on loans held for investment
(3) . . . . . . . . . . .
14.48% 15.37% 14.31% (89) bps 106 bps
Total net revenue margin
(4) . . . . . . . . . . . . . . . . . . . . . . . . .
17.25 18.04 16.57 (79) 147
Net charge-offs . . . . . . . . . . . . . . . . . . . . . . . . . . . . . . . . . . $ 2,728 $ 3,285 $ 2,944 (17)% 12%
Net charge-off rate . . . . . . . . . . . . . . . . . . . . . . . . . . . . . . . . 3.46% 4.15% 3.68% (69) bps 47 bps
Card loan premium amortization and other intangible
accretion
(5) . . . . . . . . . . . . . . . . . . . . . . . . . . . . . . . . . . .
$ 97 $ 198 $ 206 (51)% (4)%
PCCR intangible amortization . . . . . . . . . . . . . . . . . . . . . . . 369 434 350 (15) 24
Purchase volume
(6)
. . . . . . . . . . . . . . . . . . . . . . . . . . . . . . . . 224,750 201,074 180,599 12 11
December 31, December 31,
(Dollars in millions) 2014 2013 Change
Selected period-end data:
Loans held for investment
(2)
. . . . . . . . . . . . . . . . . . . . . . . . . $ 85,876 $ 81,305 6%
30+ day performing delinquency rate . . . . . . . . . . . . . . . . . . 3.24% 3.46% (22) bps
30+ day delinquency rate . . . . . . . . . . . . . . . . . . . . . . . . . . . 3.30 3.54 (24)
Nonperforming loan rate . . . . . . . . . . . . . . . . . . . . . . . . . . . 0.08 0.11 (3)
Allowance for loan and lease losses . . . . . . . . . . . . . . . . . . . $ 3,204 $ 3,214 —%
Allowance coverage ratio
(7)
. . . . . . . . . . . . . . . . . . . . . . . . . 3.73% 3.95% (22) bps
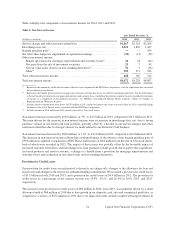
(1) We recognize billed finance charges and fee income on open-ended loans in accordance with the contractual provisions of the credit
arrangements and estimate the uncollectible amount on a quarterly basis. The estimated uncollectible amount of billed finance charges and
fees is reflected as a reduction in revenue and is not included in our net charge-offs. Total net revenue was reduced by $645 million, $796
million and $937 million in 2014, 2013 and 2012, respectively, for the estimated uncollectible amount of billed finance charges and fees.
The finance charge and fee reserve totaled $216 million and $190 million as of December 31, 2014 and 2013, respectively.
(2) Period-end loans held for investment and average loans held for investment include accrued finance charges and fees, net of the estimated
uncollectible amount.
(3) Calculated by dividing interest income for the period by average loans held for investment during the period. Interest income excludes
various allocations including funds transfer pricing that assigns certain balance sheet assets, deposits and other liabilities and their related
revenue and expenses attributable to each business segment. The transfer of the Best Buy Stores, L.P. (“Best Buy”) loan portfolio to held
for sale resulted in an increase in the average yield for the total Credit Card business of 90 basis points in 2013.
(4) Calculated by dividing total net revenue for the period by average loans held for investment during the period for the specified loan category.
Interest income also includes interest income on loans held for sale. The transfer of the Best Buy loan portfolio from loans held for investment
to loans held for sale resulted in an increase in the net revenue margin for the total Credit Card business of 100 basis points in 2013.
(5) Represents the net reduction in interest income attributable to the amortization of premiums on purchased loans accounted for based on
contractual cash flows and the accretion of other intangibles associated with the 2012 U.S. card acquisition.
(6) Consists of credit card purchase transactions, net of returns for the period for both loans classified as held for investment and loans classified
as held for sale. Excludes cash advance and balance transfer transactions.
(7) Calculated by dividing the allowance for loan and lease losses as of the end of the period by period-end loans held for investment.
58 Capital One Financial Corporation (COF)