Capital One 2014 Annual Report Download - page 179
Download and view the complete annual report
Please find page 179 of the 2014 Capital One annual report below. You can navigate through the pages in the report by either clicking on the pages listed below, or by using the keyword search tool below to find specific information within the annual report.-
 1
1 -
2
-
3
-
4
-
5
-
6
-
7
-
8
-
9
-
10
-
11
-
12
-
13
-
14
-
15
-
16
-
17
-
18
-
19
-
20
-
21
-
22
-
23
-
24
-
25
-
26
-
27
-
28
-
29
-
30
-
31
-
32
-
33
-
34
-
35
-
36
-
37
-
38
-
39
-
40
-
41
-
42
-
43
-
44
-
45
-
46
-
47
-
48
-
49
-
50
-
51
-
52
-
53
-
54
-
55
-
56
-
57
-
58
-
59
-
60
-
61
-
62
-
63
-
64
-
65
-
66
-
67
-
68
-
69
-
70
-
71
-
72
-
73
-
74
-
75
-
76
-
77
-
78
-
79
-
80
-
81
-
82
-
83
-
84
-
85
-
86
-
87
-
88
-
89
-
90
-
91
-
92
-
93
-
94
-
95
-
96
-
97
-
98
-
99
-
100
-
101
-
102
-
103
-
104
-
105
-
106
-
107
-
108
-
109
-
110
-
111
-
112
-
113
-
114
-
115
-
116
-
117
-
118
-
119
-
120
-
121
-
122
-
123
-
124
-
125
-
126
-
127
-
128
-
129
-
130
-
131
-
132
-
133
-
134
-
135
-
136
-
137
-
138
-
139
-
140
-
141
-
142
-
143
-
144
-
145
-
146
-
147
-
148
-
149
-
150
-
151
-
152
-
153
-
154
-
155
-
156
-
157
-
158
-
159
-
160
-
161
-
162
-
163
-
164
-
165
-
166
-
167
-
168
-
 169
169 -
 170
170 -
 171
171 -
 172
172 -
 173
173 -
 174
174 -
 175
175 -
 176
176 -
 177
177 -
 178
178 -
 179
179 -
 180
180 -
 181
181 -
 182
182 -
 183
183 -
 184
184 -
 185
185 -
 186
186 -
 187
187 -
 188
188 -
 189
189 -
190
-
191
-
192
-
193
-
194
-
195
-
196
-
197
-
198
-
199
-
200
-
201
-
202
-
203
-
204
-
205
-
206
-
207
-
208
-
209
-
210
-
211
-
212
-
213
-
214
-
215
-
216
-
217
-
218
-
219
-
220
-
221
-
222
-
223
-
224
-
225
-
226
-
227
-
228
-
229
-
230
-
231
-
232
-
233
-
234
-
235
-
236
-
237
-
238
-
239
-
240
-
241
-
242
-
243
-
244
-
245
-
246
-
247
-
248
-
249
-
250
-
251
-
252
-
253
-
254
-
255
-
256
-
257
-
258
-
259
-
260
-
261
-
262
-
263
-
264
-
265
-
266
-
267
-
268
-
269
-
270
-
271
-
272
-
273
-
274
-
275
-
276
-
277
-
278
-
279
-
280
-
281
-
282
-
283
-
284
-
285
-
286
-
287
-
288
-
289
-
290
-
291
-
292
-
293
-
294
-
295
-
296
-
297
-
298
-
299
-
300
 |
 |

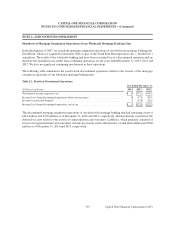
157
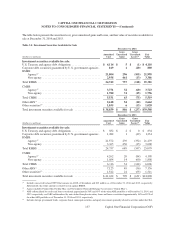
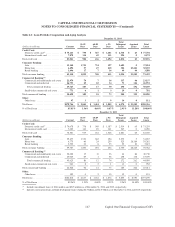
The table below presents the amortized cost, gross unrealized gains and losses, and fair value of securities available for
sale at December 31, 2014 and 2013.
Table 3.2: Investment Securities Available for Sale
December 31, 2014
Gross Gross
Amortized Unrealized Unrealized Fair
(Dollars in millions) Cost Gains Losses(1) Value
Investment securities available for sale:
U.S. Treasury and agency debt obligations . . . . . . . . . . . . . . . . . . . . $ 4,114 $ 5 $ (1) $ 4,118
Corporate debt securities guaranteed by U.S. government agencies . 819 1 (20) 800
RMBS:
Agency(2) . . . . . . . . . . . . . . . . . . . . . . . . . . . . . . . . . . . . . . . . . . 21,804 296 (105) 21,995
Non-agency . . . . . . . . . . . . . . . . . . . . . . . . . . . . . . . . . . . . . . . . 2,938 461 (13) 3,386
Total RMBS . . . . . . . . . . . . . . . . . . . . . . . . . . . . . . . . . . . . . . . . . . . . 24,742 757 (118) 25,381
CMBS:
Agency(2) . . . . . . . . . . . . . . . . . . . . . . . . . . . . . . . . . . . . . . . . . . 3,751 32 (60) 3,723
Non-agency . . . . . . . . . . . . . . . . . . . . . . . . . . . . . . . . . . . . . . . . 1,780 31 (15) 1,796
Total CMBS . . . . . . . . . . . . . . . . . . . . . . . . . . . . . . . . . . . . . . . . . . . . 5,531 63 (75) 5,519
Other ABS(3) . . . . . . . . . . . . . . . . . . . . . . . . . . . . . . . . . . . . . . . . . . . . 2,618 54 (10) 2,662
Other securities(4) . . . . . . . . . . . . . . . . . . . . . . . . . . . . . . . . . . . . . . . . 1,035 6 (13) 1,028
Total investment securities available for sale . . . . . . . . . . . . . . . . . . $ 38,859 $ 886 $ (237) $39,508
December 31, 2013
Gross Gross
Amortized Unrealized Unrealized Fair
(Dollars in millions) Cost Gains Losses(1) Value
Investment securities available for sale:
U.S. Treasury and agency debt obligations . . . . . . . . . . . . . . . . . . . . $ 832 $ 2 $ 0 $ 834
Corporate debt securities guaranteed by U.S. government agencies . 1,282 1 (49) 1,234
RMBS:
Agency(2) . . . . . . . . . . . . . . . . . . . . . . . . . . . . . . . . . . . . . . . . . . 21,572 239 (332) 21,479
Non-agency . . . . . . . . . . . . . . . . . . . . . . . . . . . . . . . . . . . . . . . . 3,165 450 (15) 3,600
Total RMBS . . . . . . . . . . . . . . . . . . . . . . . . . . . . . . . . . . . . . . . . . . . . 24,737 689 (347) 25,079
CMBS:
Agency(2) . . . . . . . . . . . . . . . . . . . . . . . . . . . . . . . . . . . . . . . . . . 4,262 20 (84) 4,198
Non-agency . . . . . . . . . . . . . . . . . . . . . . . . . . . . . . . . . . . . . . . . 1,854 14 (60) 1,808
Total CMBS . . . . . . . . . . . . . . . . . . . . . . . . . . . . . . . . . . . . . . . . . . . . 6,116 34 (144) 6,006
Other ABS(3) . . . . . . . . . . . . . . . . . . . . . . . . . . . . . . . . . . . . . . . . . . . . 7,123 49 (36) 7,136
Other securities(4) . . . . . . . . . . . . . . . . . . . . . . . . . . . . . . . . . . . . . . . . 1,542 24 (55) 1,511
Total investment securities available for sale . . . . . . . . . . . . . . . . . . $ 41,632 $ 799 $ (631) $41,800
(1) Includes non-credit related OTTI that remains in AOCI of $8 million and $12 million as of December 31, 2014 and 2013, respectively.
Substantially this entire amount is related to non-agency RMBS.
(2) Agency includes Fannie Mae, Freddie Mac, and Government National Mortgage Association (“Ginnie Mae”).
(3) ABS collateralized by credit card loans constituted approximately 56% and 65% of the other ABS portfolio as of December 31, 2014, and
2013, respectively, and ABS collateralized by auto dealer floor plan inventory loans and leases constituted approximately 16% and 15% of
the other ABS portfolio as of December 31, 2014 and 2013, respectively.
(4) Includes foreign government bonds, corporate bonds, municipal securities and equity investments primarily related to activities under the CRA.
CAPITAL ONE FINANCIAL CORPORATION
NOTES TO CONSOLIDATED FINANCIAL STATEMENTS—(Continued)
Capital One Financial Corporation (COF)