Capital One 2014 Annual Report Download - page 288
Download and view the complete annual report
Please find page 288 of the 2014 Capital One annual report below. You can navigate through the pages in the report by either clicking on the pages listed below, or by using the keyword search tool below to find specific information within the annual report.-
 1
1 -
2
-
3
-
4
-
5
-
6
-
7
-
8
-
9
-
10
-
11
-
12
-
13
-
14
-
15
-
16
-
17
-
18
-
19
-
20
-
21
-
22
-
23
-
24
-
25
-
26
-
27
-
28
-
29
-
30
-
31
-
32
-
33
-
34
-
35
-
36
-
37
-
38
-
39
-
40
-
41
-
42
-
43
-
44
-
45
-
46
-
47
-
48
-
49
-
50
-
51
-
52
-
53
-
54
-
55
-
56
-
57
-
58
-
59
-
60
-
61
-
62
-
63
-
64
-
65
-
66
-
67
-
68
-
69
-
70
-
71
-
72
-
73
-
74
-
75
-
76
-
77
-
78
-
79
-
80
-
81
-
82
-
83
-
84
-
85
-
86
-
87
-
88
-
89
-
90
-
91
-
92
-
93
-
94
-
95
-
96
-
97
-
98
-
99
-
100
-
101
-
102
-
103
-
104
-
105
-
106
-
107
-
108
-
109
-
110
-
111
-
112
-
113
-
114
-
115
-
116
-
117
-
118
-
119
-
120
-
121
-
122
-
123
-
124
-
125
-
126
-
127
-
128
-
129
-
130
-
131
-
132
-
133
-
134
-
135
-
136
-
137
-
138
-
139
-
140
-
141
-
142
-
143
-
144
-
145
-
146
-
147
-
148
-
149
-
150
-
151
-
152
-
153
-
154
-
155
-
156
-
157
-
158
-
159
-
160
-
161
-
162
-
163
-
164
-
165
-
166
-
167
-
168
-
169
-
170
-
171
-
172
-
173
-
174
-
175
-
176
-
177
-
178
-
179
-
180
-
181
-
182
-
183
-
184
-
185
-
186
-
187
-
188
-
189
-
190
-
191
-
192
-
193
-
194
-
195
-
196
-
197
-
198
-
199
-
200
-
201
-
202
-
203
-
204
-
205
-
206
-
207
-
208
-
209
-
210
-
211
-
212
-
213
-
214
-
215
-
216
-
217
-
218
-
219
-
220
-
221
-
222
-
223
-
224
-
225
-
226
-
227
-
228
-
229
-
230
-
231
-
232
-
233
-
234
-
235
-
236
-
237
-
238
-
239
-
240
-
241
-
242
-
243
-
244
-
245
-
246
-
247
-
248
-
249
-
250
-
251
-
252
-
253
-
254
-
255
-
256
-
257
-
258
-
259
-
260
-
261
-
262
-
263
-
264
-
265
-
266
-
267
-
268
-
269
-
270
-
271
-
272
-
273
-
274
-
275
-
276
-
277
-
 278
278 -
 279
279 -
 280
280 -
 281
281 -
 282
282 -
 283
283 -
 284
284 -
 285
285 -
 286
286 -
 287
287 -
 288
288 -
 289
289 -
 290
290 -
 291
291 -
 292
292 -
 293
293 -
 294
294 -
 295
295 -
 296
296 -
 297
297 -
 298
298 -
299
-
300
 |
 |

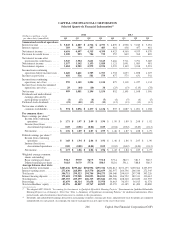
2014 2013
(Dollars in millions, except
per share data) (unaudited) Q4 Q3 Q2 Q1 Q4 Q3 Q2 Q1
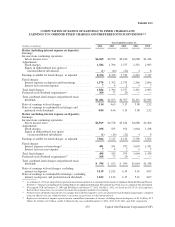
Summarized results of operations:
Interest income . . . . . . . . . . . . . . . $ 5,045 $ 4,887 $ 4,712 $ 4,753 $ 4,839 $ 4,998 $ 5,010 $ 5,051
Interest expense . . . . . . . . . . . . . . . 389 390 397 403 416 438 457 481
Net interest income . . . . . . . . . . . . 4,656 4,497 4,315 4,350 4,423 4,560 4,553 4,570
Provision for credit losses . . . . . . . 1,109 993 704 735 957 849 762 885
Net interest income after
provision for credit losses . . . . . 3,547 3,504 3,611 3,615 3,466 3,711 3,791 3,685
Non-interest income . . . . . . . . . . . 1,157 1,142 1,153 1,020 1,121 1,091 1,085 981
Non-interest expense . . . . . . . . . . . 3,284 2,985 2,979 2,932 3,235 3,109 3,018 2,991
Income from continuing
operations before income taxes . 1,420 1,661 1,785 1,703 1,352 1,693 1,858 1,675
Income tax provision . . . . . . . . . . . 450 536 581 579 477 575 631 541
Income from continuing
operations, net of tax . . . . . . . . . 970 1,125 1,204 1,124 875 1,118 1,227 1,134
Income (loss) from discontinued
operations, net of tax . . . . . . . . . 29 (44) (10) 30 (23) (13) (119) (78)
Net income . . . . . . . . . . . . . . . . . . . 999 1,081 1,194 1,154 852 1,105 1,108 1,056
Dividends and undistributed
earnings allocated to
participating securities(2) . . . . . . (4) (5) (4) (5) (4) (5) (4) (5)
Preferred stock dividends . . . . . . . (21) (20) (13) (13) (13) (13) (13) (13)
Net income available to
common stockholders . . . . . . . . $ 974 $ 1,056 $ 1,177 $ 1,136 $ 835 $ 1,087 $ 1,091 $ 1,038
Per common share:
Basic earnings per share:(2)
Income from continuing
operations . . . . . . . . . . . . . . . . $ 1.71 $ 1.97 $ 2.09 $ 1.94 $ 1.50 $ 1.89 $ 2.08 $ 1.92
Income (loss) from
discontinued operations . . . . . 0.05 (0.08) (0.02) 0.05 (0.04) (0.02) (0.20) (0.13)
Net income . . . . . . . . . . . . . . . . . $ 1.76 $ 1.89 $ 2.07 $ 1.99 $ 1.46 $ 1.87 $ 1.88 $ 1.79
Diluted earnings per share:(2)
Income from continuing
operations . . . . . . . . . . . . . . . . . $ 1.68 $ 1.94 $ 2.06 $ 1.91 $ 1.46 $ 1.86 $ 2.05 $ 1.90
Income (loss) from
discontinued operations . . . . . 0.05 (0.08) (0.02) 0.05 (0.03) (0.02) (0.20) (0.13)
Net income . . . . . . . . . . . . . . . . . $ 1.73 $ 1.86 $ 2.04 $ 1.96 $ 1.43 $ 1.84 $ 1.85 $ 1.77
Weighted average common
shares outstanding:
Basic earnings per share . . . . . . 554.3 559.9 567.5 571.0 573.4 582.3 581.5 580.5
Diluted earnings per share . . . . . 561.8 567.9 577.6 580.3 582.6 591.1 588.8 586.3
Average balance sheet data:
Loans held for investment . . . . . . . $203,436 $199,422 $194,996 $193,722 $192,813 $191,135 $190,562 $195,997
Interest-earning assets . . . . . . . . . . 273,436 268,890 263,570 262,659 262,957 264,796 266,544 272,345
Total assets . . . . . . . . . . . . . . . . . . . 304,711 299,523 294,744 294,275 294,040 294,919 297,748 303,226
Interest-bearing deposits . . . . . . . . 179,401 179,928 182,053 184,183 184,206 186,752 189,311 190,612
Total deposits . . . . . . . . . . . . . . . . . 205,355 205,199 206,315 205,842 205,706 208,340 210,650 211,555
Borrowings . . . . . . . . . . . . . . . . . . 43,479 40,314 35,658 35,978 36,463 36,355 36,915 41,574
Total stockholders’ equity . . . . . . . 45,576 44,827 43,767 42,859 42,355 41,185 41,490 40,880
(1) We adopted ASU 2014-01 “Accounting for Investments in Qualified Affordable Housing Projects” (Investments in Qualified Affordable
Housing Projects) as of January 1, 2014. See “Note 1—Summary of Significant Accounting Policies” for additional information. Prior
period results and related metrics have been recast to conform to this presentation.
(2) Dividends and undistributed earnings allocated to participating securities, earnings per share, and preferred stock dividends are computed
independently for each period. Accordingly, the sum of each quarter may not agree to the year-to-date total.
266
CAPITAL ONE FINANCIAL CORPORATION
Selected Quarterly Financial Information(1)
Capital One Financial Corporation (COF)