Capital One 2014 Annual Report Download - page 116
Download and view the complete annual report
Please find page 116 of the 2014 Capital One annual report below. You can navigate through the pages in the report by either clicking on the pages listed below, or by using the keyword search tool below to find specific information within the annual report.-
 1
1 -
2
-
3
-
4
-
5
-
6
-
7
-
8
-
9
-
10
-
11
-
12
-
13
-
14
-
15
-
16
-
17
-
18
-
19
-
20
-
21
-
22
-
23
-
24
-
25
-
26
-
27
-
28
-
29
-
30
-
31
-
32
-
33
-
34
-
35
-
36
-
37
-
38
-
39
-
40
-
41
-
42
-
43
-
44
-
45
-
46
-
47
-
48
-
49
-
50
-
51
-
52
-
53
-
54
-
55
-
56
-
57
-
58
-
59
-
60
-
61
-
62
-
63
-
64
-
65
-
66
-
67
-
68
-
69
-
70
-
71
-
72
-
73
-
74
-
75
-
76
-
77
-
78
-
79
-
80
-
81
-
82
-
83
-
84
-
85
-
86
-
87
-
88
-
89
-
90
-
91
-
92
-
93
-
94
-
95
-
96
-
97
-
98
-
99
-
100
-
101
-
102
-
103
-
104
-
105
-
 106
106 -
 107
107 -
 108
108 -
 109
109 -
 110
110 -
 111
111 -
 112
112 -
 113
113 -
 114
114 -
 115
115 -
 116
116 -
 117
117 -
 118
118 -
 119
119 -
 120
120 -
 121
121 -
 122
122 -
 123
123 -
 124
124 -
 125
125 -
 126
126 -
127
-
128
-
129
-
130
-
131
-
132
-
133
-
134
-
135
-
136
-
137
-
138
-
139
-
140
-
141
-
142
-
143
-
144
-
145
-
146
-
147
-
148
-
149
-
150
-
151
-
152
-
153
-
154
-
155
-
156
-
157
-
158
-
159
-
160
-
161
-
162
-
163
-
164
-
165
-
166
-
167
-
168
-
169
-
170
-
171
-
172
-
173
-
174
-
175
-
176
-
177
-
178
-
179
-
180
-
181
-
182
-
183
-
184
-
185
-
186
-
187
-
188
-
189
-
190
-
191
-
192
-
193
-
194
-
195
-
196
-
197
-
198
-
199
-
200
-
201
-
202
-
203
-
204
-
205
-
206
-
207
-
208
-
209
-
210
-
211
-
212
-
213
-
214
-
215
-
216
-
217
-
218
-
219
-
220
-
221
-
222
-
223
-
224
-
225
-
226
-
227
-
228
-
229
-
230
-
231
-
232
-
233
-
234
-
235
-
236
-
237
-
238
-
239
-
240
-
241
-
242
-
243
-
244
-
245
-
246
-
247
-
248
-
249
-
250
-
251
-
252
-
253
-
254
-
255
-
256
-
257
-
258
-
259
-
260
-
261
-
262
-
263
-
264
-
265
-
266
-
267
-
268
-
269
-
270
-
271
-
272
-
273
-
274
-
275
-
276
-
277
-
278
-
279
-
280
-
281
-
282
-
283
-
284
-
285
-
286
-
287
-
288
-
289
-
290
-
291
-
292
-
293
-
294
-
295
-
296
-
297
-
298
-
299
-
300
 |
 |

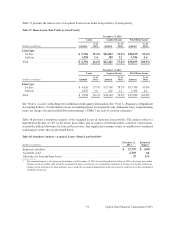
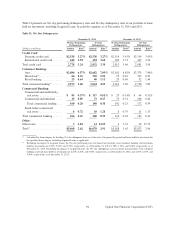
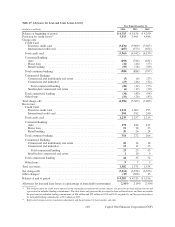
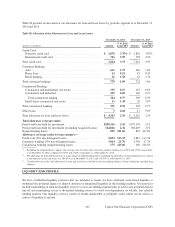
Table 21 presents our 30+ day performing delinquency rates and 30+ day delinquency rates of our portfolio of loans
held for investment, including Acquired Loans, by portfolio segment, as of December 31, 2014 and 2013.
Table 21: 30+ Day Delinquencies
December 31, 2014 December 31, 2013
30+ Day Performing 30+ Day 30+ Day Performing 30+ Day
Delinquencies Delinquencies Delinquencies Delinquencies
(Dollars in millions) Amount Rate(1) Amount Rate(1) Amount Rate(1) Amount Rate(1)
Credit Card:
Domestic credit card . . . . . . . . . $2,538 3.27% $2,538 3.27% $2,514 3.43% $2,514 3.43%
International credit card . . . . . . . 240 2.94 294 3.60 299 3.71 367 4.56
Total credit card . . . . . . . . . . . . . . 2,778 3.24 2,832 3.30 2,813 3.46 2,881 3.54
Consumer Banking:
Auto . . . . . . . . . . . . . . . . . . . . . . $2,486 6.57% $2,682 7.09% $2,181 6.85% $2,375 7.46%
Home loan(2) . . . . . . . . . . . . . . . . 64 0.21 302 1.01 55 0.16 323 0.91
Retail banking . . . . . . . . . . . . . . 23 0.64 40 1.11 25 0.69 52 1.44
Total consumer banking(2) . . . . . . . 2,573 3.60 3,024 4.23 2,261 3.20 2,750 3.89
Commercial Banking:
Commercial and multifamily
real estate . . . . . . . . . . . . . . . . $ 85 0.37% $ 117 0.51% $ 29 0.14% $ 64 0.31%
Commercial and industrial . . . . 15 0.05 73 0.27 73 0.31 108 0.46
Total commercial lending . . . . 100 0.20 190 0.38 102 0.23 172 0.39
Small-ticket commercial
real estate . . . . . . . . . . . . . . . . 6 0.72 10 1.28 8 0.79 11 1.17
Total commercial banking . . . . . . . 106 0.21 200 0.39 110 0.24 183 0.41
Other:
Other loans . . . . . . . . . . . . . . . . . . 3 2.84 14 12.23 4 3.32 19 15.72
Total(2) . . . . . . . . . . . . . . . . . . . . . . $5,460 2.62 $6,070 2.91 $5,188 2.63 $5,833 2.96
(1) Calculated by loan category by dividing 30+ day delinquent loans as of the end of the period by period-end loans held for investment for
the specified loan category, including Acquired Loans as applicable.
(2) Excluding the impact of Acquired Loans, the 30+ day performing rates for home loan portfolio, total consumer banking, and total loans
held for investment are 0.94%, 5.34%, and 2.95%, respectively, as of December 31, 2014, 0.78%, 5.32%, and 3.08%, respectively, as of
December 31, 2013. Excluding the impact of Acquired Loans, the 30+ day delinquency rates for home loan portfolio, total consumer
banking, and total loans held for investment are 4.45%, 6.28%, and 3.28%, respectively, as of December 31, 2014, and 4.55%, 6.47%, and
3.46%, respectively, as of December 31, 2013.
94 Capital One Financial Corporation (COF)