Capital One 2014 Annual Report Download - page 113
Download and view the complete annual report
Please find page 113 of the 2014 Capital One annual report below. You can navigate through the pages in the report by either clicking on the pages listed below, or by using the keyword search tool below to find specific information within the annual report.-
 1
1 -
2
-
3
-
4
-
5
-
6
-
7
-
8
-
9
-
10
-
11
-
12
-
13
-
14
-
15
-
16
-
17
-
18
-
19
-
20
-
21
-
22
-
23
-
24
-
25
-
26
-
27
-
28
-
29
-
30
-
31
-
32
-
33
-
34
-
35
-
36
-
37
-
38
-
39
-
40
-
41
-
42
-
43
-
44
-
45
-
46
-
47
-
48
-
49
-
50
-
51
-
52
-
53
-
54
-
55
-
56
-
57
-
58
-
59
-
60
-
61
-
62
-
63
-
64
-
65
-
66
-
67
-
68
-
69
-
70
-
71
-
72
-
73
-
74
-
75
-
76
-
77
-
78
-
79
-
80
-
81
-
82
-
83
-
84
-
85
-
86
-
87
-
88
-
89
-
90
-
91
-
92
-
93
-
94
-
95
-
96
-
97
-
98
-
99
-
100
-
101
-
102
-
 103
103 -
 104
104 -
 105
105 -
 106
106 -
 107
107 -
 108
108 -
 109
109 -
 110
110 -
 111
111 -
 112
112 -
 113
113 -
 114
114 -
 115
115 -
 116
116 -
 117
117 -
 118
118 -
 119
119 -
 120
120 -
 121
121 -
 122
122 -
 123
123 -
124
-
125
-
126
-
127
-
128
-
129
-
130
-
131
-
132
-
133
-
134
-
135
-
136
-
137
-
138
-
139
-
140
-
141
-
142
-
143
-
144
-
145
-
146
-
147
-
148
-
149
-
150
-
151
-
152
-
153
-
154
-
155
-
156
-
157
-
158
-
159
-
160
-
161
-
162
-
163
-
164
-
165
-
166
-
167
-
168
-
169
-
170
-
171
-
172
-
173
-
174
-
175
-
176
-
177
-
178
-
179
-
180
-
181
-
182
-
183
-
184
-
185
-
186
-
187
-
188
-
189
-
190
-
191
-
192
-
193
-
194
-
195
-
196
-
197
-
198
-
199
-
200
-
201
-
202
-
203
-
204
-
205
-
206
-
207
-
208
-
209
-
210
-
211
-
212
-
213
-
214
-
215
-
216
-
217
-
218
-
219
-
220
-
221
-
222
-
223
-
224
-
225
-
226
-
227
-
228
-
229
-
230
-
231
-
232
-
233
-
234
-
235
-
236
-
237
-
238
-
239
-
240
-
241
-
242
-
243
-
244
-
245
-
246
-
247
-
248
-
249
-
250
-
251
-
252
-
253
-
254
-
255
-
256
-
257
-
258
-
259
-
260
-
261
-
262
-
263
-
264
-
265
-
266
-
267
-
268
-
269
-
270
-
271
-
272
-
273
-
274
-
275
-
276
-
277
-
278
-
279
-
280
-
281
-
282
-
283
-
284
-
285
-
286
-
287
-
288
-
289
-
290
-
291
-
292
-
293
-
294
-
295
-
296
-
297
-
298
-
299
-
300
 |
 |

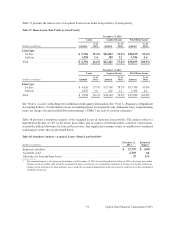
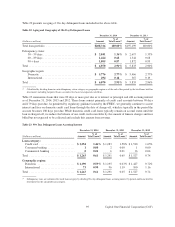
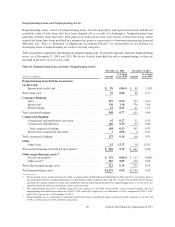
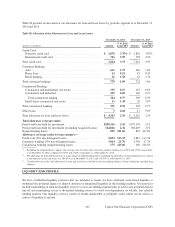
Table 17 presents the relative size of Acquired Loans in our home loan portfolio, by lien priority.
Table 17: Home Loans: Risk Profile by Lien Priority
December 31, 2014
Loans Acquired Loans Total Home Loans
%of % of % of
(Dollars in millions) Amount Total Amount Total Amount Total
Lien type:
1st lien
. . . . . . . . . . . . . . . . . . . . . . . . . . . . . .
$ 5,756 19.2% $22,883 76.2% $28,639 95.4%
2nd lien
. . . . . . . . . . . . . . . . . . . . . . . . . . . . .
1,038 3.4 358 1.2 1,396 4.6
Total . . . . . . . . . . . . . . . . . . . . . . . . . . . . . . . . . .
$ 6,794 22.6% $23,241 77.4% $30,035 100.0%
December 31, 2013
Loans Acquired Loans Total Home Loans
%of % of % of
(Dollars in millions) Amount Total Amount Total Amount Total
Lien type:
1st lien
. . . . . . . . . . . . . . . . . . . . . . . . . . . . . .
$ 6,020 17.1% $ 27,768 78.7% $ 33,788 95.8%
2nd lien . . . . . . . . . . . . . . . . . . . . . . . . . . . . . . 1,078 3.0 416 1.2 1,494 4.2
Total . . . . . . . . . . . . . . . . . . . . . . . . . . . . . . . . . . $ 7,098 20.1% $ 28,184 79.9% $ 35,282 100.0%
See “Note 4—Loans” in this Report for additional credit quality information. See “Note 1—Summary of Significant
Accounting Policies” for information on our accounting policies for Acquired Loans, delinquent loans, nonperforming
loans, net charge-offs and troubled debt restructurings (“TDRs”) for each of our loan categories.
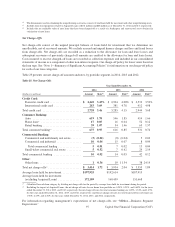
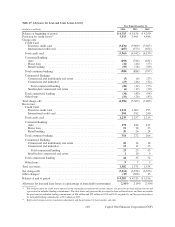
Table 18 provides a sensitivity analysis of the Acquired Loans in our home loan portfolio. The analysis reflects a
hypothetical decline of 10% in the home price index and its impact on lifetime future cash flow expectations,
accretable yield and allowance for loan and lease losses. Any significant economic events or variables not considered
could impact results that are presented below.
Table 18: Sensitivity Analysis—Acquired Loans—Home Loan Portfolio(1)
December 31, Estimated
(Dollars in millions) 2014 Impact
Expected cash flows . . . . . . . . . . . . . . . . . . . . . . . . . . . . . . . . . . . . . . . . . . . . . . . . . . . . . .
$ 27,797 $ (109)
Accretable yield . . . . . . . . . . . . . . . . . . . . . . . . . . . . . . . . . . . . . . . . . . . . . . . . . . . . . . . . .
4,583 66
Allowance for loan and lease losses . . . . . . . . . . . . . . . . . . . . . . . . . . . . . . . . . . . . . . . . . .
27 176
(1) The estimated impact is the change in the balance as of December 31, 2014 from the hypothetical decline of 10% in the home price index.
Changes in the accretable yield would be recognized in interest income in our consolidated statements of income over the life of the loans.
Changes in the allowance for loan and lease losses would be recognized immediately in the provision for credit losses in the consolidated
statements of income.
91 Capital One Financial Corporation (COF)