Capital One 2014 Annual Report Download - page 233
Download and view the complete annual report
Please find page 233 of the 2014 Capital One annual report below. You can navigate through the pages in the report by either clicking on the pages listed below, or by using the keyword search tool below to find specific information within the annual report.-
 1
1 -
2
-
3
-
4
-
5
-
6
-
7
-
8
-
9
-
10
-
11
-
12
-
13
-
14
-
15
-
16
-
17
-
18
-
19
-
20
-
21
-
22
-
23
-
24
-
25
-
26
-
27
-
28
-
29
-
30
-
31
-
32
-
33
-
34
-
35
-
36
-
37
-
38
-
39
-
40
-
41
-
42
-
43
-
44
-
45
-
46
-
47
-
48
-
49
-
50
-
51
-
52
-
53
-
54
-
55
-
56
-
57
-
58
-
59
-
60
-
61
-
62
-
63
-
64
-
65
-
66
-
67
-
68
-
69
-
70
-
71
-
72
-
73
-
74
-
75
-
76
-
77
-
78
-
79
-
80
-
81
-
82
-
83
-
84
-
85
-
86
-
87
-
88
-
89
-
90
-
91
-
92
-
93
-
94
-
95
-
96
-
97
-
98
-
99
-
100
-
101
-
102
-
103
-
104
-
105
-
106
-
107
-
108
-
109
-
110
-
111
-
112
-
113
-
114
-
115
-
116
-
117
-
118
-
119
-
120
-
121
-
122
-
123
-
124
-
125
-
126
-
127
-
128
-
129
-
130
-
131
-
132
-
133
-
134
-
135
-
136
-
137
-
138
-
139
-
140
-
141
-
142
-
143
-
144
-
145
-
146
-
147
-
148
-
149
-
150
-
151
-
152
-
153
-
154
-
155
-
156
-
157
-
158
-
159
-
160
-
161
-
162
-
163
-
164
-
165
-
166
-
167
-
168
-
169
-
170
-
171
-
172
-
173
-
174
-
175
-
176
-
177
-
178
-
179
-
180
-
181
-
182
-
183
-
184
-
185
-
186
-
187
-
188
-
189
-
190
-
191
-
192
-
193
-
194
-
195
-
196
-
197
-
198
-
199
-
200
-
201
-
202
-
203
-
204
-
205
-
206
-
207
-
208
-
209
-
210
-
211
-
212
-
213
-
214
-
215
-
216
-
217
-
218
-
219
-
220
-
221
-
222
-
 223
223 -
 224
224 -
 225
225 -
 226
226 -
 227
227 -
 228
228 -
 229
229 -
 230
230 -
 231
231 -
 232
232 -
 233
233 -
 234
234 -
 235
235 -
 236
236 -
 237
237 -
 238
238 -
 239
239 -
 240
240 -
 241
241 -
 242
242 -
 243
243 -
244
-
245
-
246
-
247
-
248
-
249
-
250
-
251
-
252
-
253
-
254
-
255
-
256
-
257
-
258
-
259
-
260
-
261
-
262
-
263
-
264
-
265
-
266
-
267
-
268
-
269
-
270
-
271
-
272
-
273
-
274
-
275
-
276
-
277
-
278
-
279
-
280
-
281
-
282
-
283
-
284
-
285
-
286
-
287
-
288
-
289
-
290
-
291
-
292
-
293
-
294
-
295
-
296
-
297
-
298
-
299
-
300
 |
 |

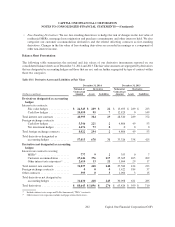
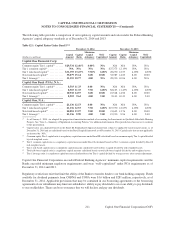
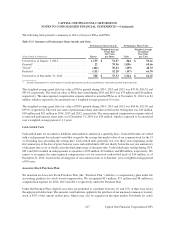
The following table provides a comparison of our regulatory capital amounts and ratios under the Federal Banking
Agencies’ capital adequacy standards as of December 31, 2014 and 2013.
Table 12.1: Capital Ratios Under Basel I(1)(2)
December 31, 2014 December 31, 2013
Minimum Minimum
Capital Capital Capital Well- Capital Capital Capital Well-
(Dollars in millions) Amount Ratio Adequacy Capitalized Amount Ratio Adequacy Capitalized
Capital One Financial Corp:
Common equity Tier 1 capital(3) . . . . . . $29,534 12.46% 4.00% N/A N/A N/A N/A N/A
Tier 1 common capital(4) . . . . . . . . . . . . N/A N/A N/A N/A $27,375 12.19% N/A N/A
Tier 1 risk-based capital(5) . . . . . . . . . . . $31,355 13.23% 5.50% 6.00% 28,230 12.57 4.00% 6.00%
Total risk-based capital(6) . . . . . . . . . . . 35,879 15.14 8.00 10.00 32,987 14.69 8.00 10.00
Tier 1 leverage(7) . . . . . . . . . . . . . . . . . . 31,355 10.77 4.00 N/A 28,230 10.06 4.00 N/A
Capital One Bank (USA), N.A.:
Common equity Tier 1 capital(3) . . . . . . 8,503 11.33 4.00 N/A N/A N/A N/A N/A
Tier 1 risk-based capital(5) . . . . . . . . . . . 8,503 11.33 5.50 6.00% $8,103 11.47% 4.00% 6.00%
Total risk-based capital(6) . . . . . . . . . . . 10,938 14.57 8.00 10.00 10,528 14.90 8.00 10.00
Tier 1 leverage(7) . . . . . . . . . . . . . . . . . . 8,503 9.64 4.00 5.00 8,103 10.21 4.00 5.00
Capital One, N.A.:
Common equity Tier 1 capital(3) . . . . . . 21,136 12.53 4.00 N/A N/A N/A N/A N/A
Tier 1 risk-based capital(5) . . . . . . . . . . . 21,136 12.53 5.50 6.00% $19,930 12.67% 4.00% 6.00%
Total risk-based capital(6) . . . . . . . . . . . 22,881 13.57 8.00 10.00 21,645 13.76 8.00 10.00
Tier 1 leverage(7) . . . . . . . . . . . . . . . . . . 21,136 8.90 4.00 5.00 19,930 8.96 4.00 5.00
(1) As of January 1, 2014, we adopted the proportional amortization method of accounting for Investments in Qualified Affordable Housing
Projects. See “Note 1—Summary of Significant Accounting Policies” for additional information. Prior periods have been recast to conform
to this presentation.
(2) Capital ratios are calculated based on the Basel III Standardized Approach framework, subject to applicable transition provisions, as of
December 31, 2014 and are calculated based on the Basel I capital framework as of December 31, 2013. Capital ratios that are not applicable
are denoted by “N/A.”
(3) Common equity Tier 1 capital ratio is a regulatory capital measure under Basel III calculated based on common equity Tier 1 capital divided
by risk-weighted assets.
(4) Tier 1 common capital ratio is a regulatory capital measure under Basel I calculated based on Tier 1 common capital divided by Basel I
risk-weighted assets.
(5) Tier 1 risk-based capital ratio is a regulatory capital measure calculated based on Tier 1 capital divided by risk-weighted assets.
(6) Total risk-based capital ratio is a regulatory capital measure calculated based on total risk-based capital divided by risk-weighted assets.
(7) Tier 1 leverage ratio is a regulatory capital measure calculated based on Tier 1 capital divided by average assets, after certain adjustments.
Capital One Financial Corporation exceeded Federal Banking Agencies’ minimum capital requirements and the
Banks exceeded minimum regulatory requirements and were “well-capitalized” under PCA requirements as of
December 31, 2014 and 2013.
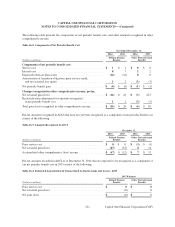
Regulatory restrictions exist that limit the ability of the Banks to transfer funds to our bank holding company. Funds
available for dividend payments from COBNA and CONA were $1.6 billion and $281 million, respectively, as of
December 31, 2014. Applicable provisions that may be contained in our borrowing agreements or the borrowing
agreements of our subsidiaries may limit our subsidiaries’ ability to pay dividends to us or our ability to pay dividends
to our stockholders. There can be no assurance that we will declare and pay any dividends.
211
CAPITAL ONE FINANCIAL CORPORATION
NOTES TO CONSOLIDATED FINANCIAL STATEMENTS—(Continued)
Capital One Financial Corporation (COF)