Sallie Mae 2009 Annual Report Download - page 99
Download and view the complete annual report
Please find page 99 of the 2009 Sallie Mae annual report below. You can navigate through the pages in the report by either clicking on the pages listed below, or by using the keyword search tool below to find specific information within the annual report.-
 1
1 -
2
-
3
-
4
-
5
-
6
-
7
-
8
-
9
-
10
-
11
-
12
-
13
-
14
-
15
-
16
-
17
-
18
-
19
-
20
-
21
-
22
-
23
-
24
-
25
-
26
-
27
-
28
-
29
-
30
-
31
-
32
-
33
-
34
-
35
-
36
-
37
-
38
-
39
-
40
-
41
-
42
-
43
-
44
-
45
-
46
-
47
-
48
-
49
-
50
-
51
-
52
-
53
-
54
-
55
-
56
-
57
-
58
-
59
-
60
-
61
-
62
-
63
-
64
-
65
-
66
-
67
-
68
-
69
-
70
-
71
-
72
-
73
-
74
-
75
-
76
-
77
-
78
-
79
-
80
-
81
-
82
-
83
-
84
-
85
-
86
-
87
-
88
-
 89
89 -
 90
90 -
 91
91 -
 92
92 -
 93
93 -
 94
94 -
 95
95 -
 96
96 -
 97
97 -
 98
98 -
 99
99 -
 100
100 -
 101
101 -
 102
102 -
 103
103 -
 104
104 -
 105
105 -
 106
106 -
 107
107 -
 108
108 -
 109
109 -
110
-
111
-
112
-
113
-
114
-
115
-
116
-
117
-
118
-
119
-
120
-
121
-
122
-
123
-
124
-
125
-
126
-
127
-
128
-
129
-
130
-
131
-
132
-
133
-
134
-
135
-
136
-
137
-
138
-
139
-
140
-
141
-
142
-
143
-
144
-
145
-
146
-
147
-
148
-
149
-
150
-
151
-
152
-
153
-
154
-
155
-
156
-
157
-
158
-
159
-
160
-
161
-
162
-
163
-
164
-
165
-
166
-
167
-
168
-
169
-
170
-
171
-
172
-
173
-
174
-
175
-
176
-
177
-
178
-
179
-
180
-
181
-
182
-
183
-
184
-
185
-
186
-
187
-
188
-
189
-
190
-
191
-
192
-
193
-
194
-
195
-
196
-
197
-
198
-
199
-
200
-
201
-
202
-
203
-
204
-
205
-
206
-
207
-
208
-
209
-
210
-
211
-
212
-
213
-
214
-
215
-
216
-
217
-
218
-
219
-
220
-
221
-
222
-
223
-
224
-
225
-
226
-
227
-
228
-
229
-
230
-
231
-
232
-
233
-
234
-
235
-
236
-
237
-
238
-
239
-
240
-
241
-
242
-
243
-
244
-
245
-
246
-
247
-
248
-
249
-
250
-
251
-
252
-
253
-
254
-
255
-
256
 |
 |

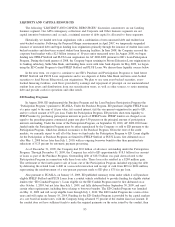
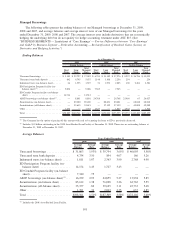
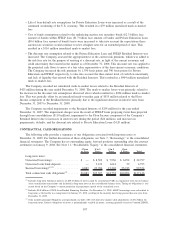
2009. The covenants also require the Company to meet either a minimum interest coverage ratio or a minimum net
adjusted revenue test based on the four preceding quarters’ adjusted “Core Earnings” financial performance. The
Company was compliant with both of the minimum interest coverage ratio and the minimum net adjusted revenue
tests as of the quarter ended December 31, 2009. In the past, we have not relied upon our unsecured revolving
credit facilities as a primary source of liquidity. Even though we have never borrowed under these facilities, they
are available to be drawn upon for general corporate purposes.
During the year, the Company’s new financing transactions generated excess liquidity, some of which was
used to repurchase $3.4 billion of the Company’s short-term senior unsecured notes, generating pre-tax gains
of $536 million.
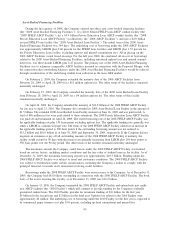
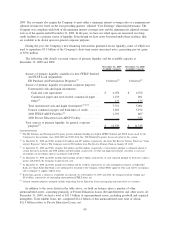
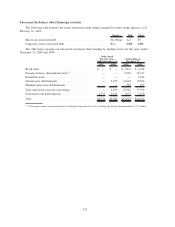
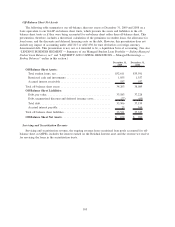
The following table details our main sources of primary liquidity and the available capacity at
December 31, 2009 and 2008.
December 31, 2009
Available Capacity
December 31, 2008
Available Capacity
Sources of primary liquidity available for new FFELP Stafford
and PLUS Loan originations:
ED Purchase and Participation Programs
(1)
............. Unlimited
(1)
Unlimited
(1)
Sources of primary liquidity for general corporate purposes:
Unrestricted cash and liquid investments:
Cash and cash equivalents . . ...................... $ 6,070 $ 4,070
Commercial paper and asset-backed commercial paper . . . 1,150 801
Other
(2)
...................................... 131 133
Total unrestricted cash and liquid investments
(3)(4)(5)
...... 7,351 5,004
Unused commercial paper and bank lines of credit ........ 3,485 5,192
2008 FFELP ABCP Facilities
(6)
...................... 1,703 807
2008 Private Education Loan ABCP Facility ............ — 332
Total sources of primary liquidity for general corporate
purposes
(7)
..................................... $ 12,539 $ 11,335
(1)
The ED Purchase and Participation Programs provide unlimited funding for eligible FFELP Stafford and PLUS Loans made by the
Company for the academic years 2008-2009 and 2009-2010. See “ED Funding Programs” discussed earlier in this section.
(2)
At December 31, 2009 and 2008, includes $32 million and $97 million, respectively, due from The Reserve Primary Fund (see “Coun-
terparty Exposure” below). The Company received $32 million from The Reserve Primary Fund on January 29, 2010.
(3)
At December 31, 2009 and 2008, excludes $25 million and $26 million, respectively, of investments pledged as collateral related to
certain derivative positions and $708 million and $82 million, respectively, of other non-liquid investments, classified as cash and
investments on our balance sheet in accordance with GAAP.
(4)
At December 31, 2009 and 2008, includes $821 million and $1.6 billion, respectively, of cash collateral pledged by derivative counter-
parties and held by the Company in unrestricted cash.
(5)
At December 31, 2009 and 2008, includes $2.4 billion and $1.1 billion, respectively, of cash and liquid investments at Sallie Mae
Bank, for which Sallie Mae Bank is not authorized to dividend to the Company without FDIC approval. This cash will be used prima-
rily to originate or acquire student loans.
(6)
Borrowing capacity is subject to availability of collateral. As of December 31, 2009 and 2008, the Company had $2.1 billion and
$5.4 billion, respectively, of outstanding unencumbered FFELP loans, net.
(7)
General corporate purposes primarily include originating Private Education Loans and repaying unsecured debt as it matures.
In addition to the assets listed in the table above, we hold on-balance sheet a number of other
unencumbered assets, consisting primarily of Private Education Loans, Retained Interests and other assets. At
December 31, 2009, we had a total of $31.3 billion of unencumbered assets, including goodwill and acquired
intangibles. Total student loans, net, comprised $14.6 billion of this unencumbered asset total of which
$12.5 billion relates to Private Education Loans, net.
98