Sallie Mae 2009 Annual Report Download - page 195
Download and view the complete annual report
Please find page 195 of the 2009 Sallie Mae annual report below. You can navigate through the pages in the report by either clicking on the pages listed below, or by using the keyword search tool below to find specific information within the annual report.-
 1
1 -
2
-
3
-
4
-
5
-
6
-
7
-
8
-
9
-
10
-
11
-
12
-
13
-
14
-
15
-
16
-
17
-
18
-
19
-
20
-
21
-
22
-
23
-
24
-
25
-
26
-
27
-
28
-
29
-
30
-
31
-
32
-
33
-
34
-
35
-
36
-
37
-
38
-
39
-
40
-
41
-
42
-
43
-
44
-
45
-
46
-
47
-
48
-
49
-
50
-
51
-
52
-
53
-
54
-
55
-
56
-
57
-
58
-
59
-
60
-
61
-
62
-
63
-
64
-
65
-
66
-
67
-
68
-
69
-
70
-
71
-
72
-
73
-
74
-
75
-
76
-
77
-
78
-
79
-
80
-
81
-
82
-
83
-
84
-
85
-
86
-
87
-
88
-
89
-
90
-
91
-
92
-
93
-
94
-
95
-
96
-
97
-
98
-
99
-
100
-
101
-
102
-
103
-
104
-
105
-
106
-
107
-
108
-
109
-
110
-
111
-
112
-
113
-
114
-
115
-
116
-
117
-
118
-
119
-
120
-
121
-
122
-
123
-
124
-
125
-
126
-
127
-
128
-
129
-
130
-
131
-
132
-
133
-
134
-
135
-
136
-
137
-
138
-
139
-
140
-
141
-
142
-
143
-
144
-
145
-
146
-
147
-
148
-
149
-
150
-
151
-
152
-
153
-
154
-
155
-
156
-
157
-
158
-
159
-
160
-
161
-
162
-
163
-
164
-
165
-
166
-
167
-
168
-
169
-
170
-
171
-
172
-
173
-
174
-
175
-
176
-
177
-
178
-
179
-
180
-
181
-
182
-
183
-
184
-
 185
185 -
 186
186 -
 187
187 -
 188
188 -
 189
189 -
 190
190 -
 191
191 -
 192
192 -
 193
193 -
 194
194 -
 195
195 -
 196
196 -
 197
197 -
 198
198 -
 199
199 -
 200
200 -
 201
201 -
 202
202 -
 203
203 -
 204
204 -
 205
205 -
206
-
207
-
208
-
209
-
210
-
211
-
212
-
213
-
214
-
215
-
216
-
217
-
218
-
219
-
220
-
221
-
222
-
223
-
224
-
225
-
226
-
227
-
228
-
229
-
230
-
231
-
232
-
233
-
234
-
235
-
236
-
237
-
238
-
239
-
240
-
241
-
242
-
243
-
244
-
245
-
246
-
247
-
248
-
249
-
250
-
251
-
252
-
253
-
254
-
255
-
256
 |
 |

9. Derivative Financial Instruments (Continued)
The Company’s corporate derivatives contain credit contingent features. At the Company’s current
unsecured credit rating, it has fully collateralized its corporate derivative liability position of $1.1 billion with
its counterparties. Further downgrades would not result in any additional collateral requirements, except to
provide for more frequent collateral calls. Two counterparties have the right to terminate the contracts with
further downgrades, however, these counterparties are currently in an asset position and would be required to
deliver assets to the Company in order to terminate. Trust related derivatives do not contain credit contingent
features related to the Company’s or trust’s credit ratings.
Additionally, as of December 31, 2009 and 2008, $381 million and $340 million, respectively, in
collateral related to off-balance sheet trust derivatives were held by these off-balance sheet trusts. Collateral
posted by third parties to the off-balance sheet trusts cannot be sold or re-pledged by the trusts.
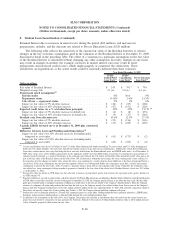
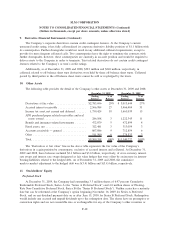
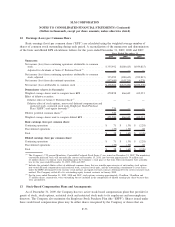
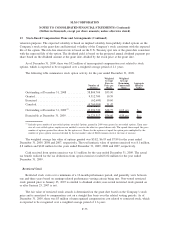
10. Other Assets
The following table provides the detail of the Company’s other assets at December 31, 2009 and 2008.
Ending
Balance
%of
Balance
Ending
Balance
%of
Balance
December 31, 2009 December 31, 2008
Derivatives at fair value .................... $2,783,696 29% $ 3,013,644 27%
Accrued interest receivable .................. 2,566,984 27 3,466,404 31
Income tax asset, net current and deferred ....... 1,750,424 18 1,661,039 15
APG purchased paper related receivables and real
estate owned ........................... 286,108 3 1,222,345 11
Benefit and insurance-related investments ....... 472,079 5 472,899 4
Fixed assets, net .......................... 322,481 3 313,059 3
Accounts receivable — general ............... 807,086 9 712,854 6
Other .................................. 511,500 6 278,533 3
Total................................... $9,500,358 100% $11,140,777 100%
The “Derivatives at fair value” line in the above table represents the fair value of the Company’s
derivatives in a gain position by counterparty, exclusive of accrued interest and collateral. At December 31,
2009 and 2008, these balances included $3.4 billion and $3.6 billion, respectively, of cross-currency interest
rate swaps and interest rate swaps designated as fair value hedges that were offset by an increase in interest-
bearing liabilities related to the hedged debt. As of December 31, 2009 and 2008, the cumulative
mark-to-market adjustment to the hedged debt was $(3.4) billion and $(3.4) billion, respectively.
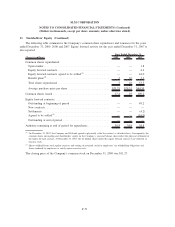
11. Stockholders’ Equity
Preferred Stock
At December 31, 2009, the Company had outstanding 3.3 million shares of 6.97 percent Cumulative
Redeemable Preferred Stock, Series A (the “Series A Preferred Stock”) and 4.0 million shares of Floating-
Rate Non-Cumulative Preferred Stock, Series B (the “Series B Preferred Stock”). Neither series has a maturity
date but can be redeemed at the Company’s option beginning November 16, 2009 for Series A Preferred
Stock, and on any dividend payment date on or after June 15, 2010 for Series B Preferred Stock. Redemption
would include any accrued and unpaid dividends up to the redemption date. The shares have no preemptive or
conversion rights and are not convertible into or exchangeable for any of the Company’s other securities or
F-68
SLM CORPORATION
NOTES TO CONSOLIDATED FINANCIAL STATEMENTS (Continued)
(Dollars in thousands, except per share amounts, unless otherwise stated)