Sallie Mae 2009 Annual Report Download - page 90
Download and view the complete annual report
Please find page 90 of the 2009 Sallie Mae annual report below. You can navigate through the pages in the report by either clicking on the pages listed below, or by using the keyword search tool below to find specific information within the annual report.-
 1
1 -
2
-
3
-
4
-
5
-
6
-
7
-
8
-
9
-
10
-
11
-
12
-
13
-
14
-
15
-
16
-
17
-
18
-
19
-
20
-
21
-
22
-
23
-
24
-
25
-
26
-
27
-
28
-
29
-
30
-
31
-
32
-
33
-
34
-
35
-
36
-
37
-
38
-
39
-
40
-
41
-
42
-
43
-
44
-
45
-
46
-
47
-
48
-
49
-
50
-
51
-
52
-
53
-
54
-
55
-
56
-
57
-
58
-
59
-
60
-
61
-
62
-
63
-
64
-
65
-
66
-
67
-
68
-
69
-
70
-
71
-
72
-
73
-
74
-
75
-
76
-
77
-
78
-
79
-
 80
80 -
 81
81 -
 82
82 -
 83
83 -
 84
84 -
 85
85 -
 86
86 -
 87
87 -
 88
88 -
 89
89 -
 90
90 -
 91
91 -
 92
92 -
 93
93 -
 94
94 -
 95
95 -
 96
96 -
 97
97 -
 98
98 -
 99
99 -
 100
100 -
101
-
102
-
103
-
104
-
105
-
106
-
107
-
108
-
109
-
110
-
111
-
112
-
113
-
114
-
115
-
116
-
117
-
118
-
119
-
120
-
121
-
122
-
123
-
124
-
125
-
126
-
127
-
128
-
129
-
130
-
131
-
132
-
133
-
134
-
135
-
136
-
137
-
138
-
139
-
140
-
141
-
142
-
143
-
144
-
145
-
146
-
147
-
148
-
149
-
150
-
151
-
152
-
153
-
154
-
155
-
156
-
157
-
158
-
159
-
160
-
161
-
162
-
163
-
164
-
165
-
166
-
167
-
168
-
169
-
170
-
171
-
172
-
173
-
174
-
175
-
176
-
177
-
178
-
179
-
180
-
181
-
182
-
183
-
184
-
185
-
186
-
187
-
188
-
189
-
190
-
191
-
192
-
193
-
194
-
195
-
196
-
197
-
198
-
199
-
200
-
201
-
202
-
203
-
204
-
205
-
206
-
207
-
208
-
209
-
210
-
211
-
212
-
213
-
214
-
215
-
216
-
217
-
218
-
219
-
220
-
221
-
222
-
223
-
224
-
225
-
226
-
227
-
228
-
229
-
230
-
231
-
232
-
233
-
234
-
235
-
236
-
237
-
238
-
239
-
240
-
241
-
242
-
243
-
244
-
245
-
246
-
247
-
248
-
249
-
250
-
251
-
252
-
253
-
254
-
255
-
256
 |
 |

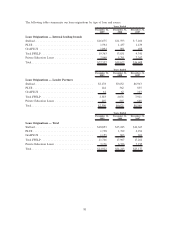
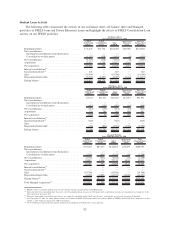
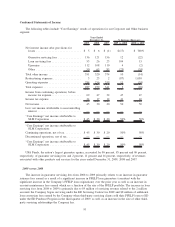
Net loss attributable to SLM Corporation from discontinued operations was $157 million and $140 million
for the years ended December 31, 2009 and 2008, respectively, compared to net income of $15 million for the
year ended December 31, 2007. The Company sold all of the assets in its Purchased Paper — Mortgage/
Properties business in the fourth quarter of 2009 for $280 million. Because of the sale, the Purchased Paper —
Mortgage/Properties business is required to be presented separately as discontinued operations for all periods
presented. This sale of assets in the fourth quarter of 2009 resulted in an after-tax loss of $95 million. Total
after-tax impairments, including the loss on sale, for the years ended December 31, 2009, 2008 and 2007 were
$154 million, $161 million and $2 million, respectively.
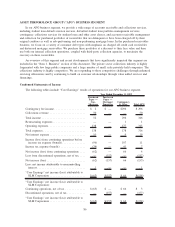
Contingency Fee Income
Contingency fee income decreased $44 million from $340 million for the year ended December 31, 2008
to $296 million for the year ended December 31, 2009. This decrease was primarily a result of significantly
less guarantor collections revenue associated with rehabilitating delinquent FFELP loans. Loans are considered
rehabilitated after a certain number of on-time payments have been collected. The Company earns a
rehabilitation fee only when the Guarantor sells the rehabilitated loan. The disruption in the credit markets has
limited the sale of rehabilitated loans.
The contingency fee income for the year ended December 31, 2008 was relatively unchanged compared
to 2007.
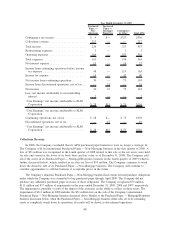
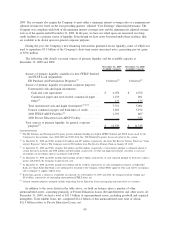
Purchased Paper — Non-Mortgage
2009 2008 2007
Years Ended
December 31,
Face value of purchases for the period .......................... $390 $5,353 $6,111
Purchase price for the period ................................. 30 483 556
Purchase price as a percentage of face value purchased .............. 7.6% 9.0% 9.1%
Gross Cash Collections (“GCC”) .............................. $376 $ 655 $ 463
Collections revenue ........................................ 50 129 217
Collections revenue as a percentage of GCC ...................... 13% 20% 47%
Carrying value of purchased paper ............................. $285 $ 544 $ 587
The decrease in collections revenue as a percentage of gross cash collections (“GCC”) in 2009 compared
to 2008 and 2007 was primarily due to the significant impairment recognized in 2008.
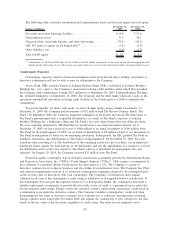
Contingency Inventory
The following table presents the outstanding inventory of receivables serviced through our APG business
segment. These assets are not on our balance sheet.
2009 2008 2007
As of
December 31,
Contingency:
Student loans ........................................ $ 8,762 $ 9,852 $8,195
Other.............................................. 1,262 1,726 1,509
Total ................................................ $10,024 $11,578 $9,704
Operating Expenses — APG Business Segment
For the years ended December 31, 2009, 2008 and 2007, operating expenses for the APG contingency
and other businesses totaled $177 million, $187 million and $197 million, respectively. The decrease in
operating expenses in 2009 versus prior years is primarily due to the Company’s cost reduction initiatives.
89