Sallie Mae 2009 Annual Report Download - page 212
Download and view the complete annual report
Please find page 212 of the 2009 Sallie Mae annual report below. You can navigate through the pages in the report by either clicking on the pages listed below, or by using the keyword search tool below to find specific information within the annual report.-
 1
1 -
2
-
3
-
4
-
5
-
6
-
7
-
8
-
9
-
10
-
11
-
12
-
13
-
14
-
15
-
16
-
17
-
18
-
19
-
20
-
21
-
22
-
23
-
24
-
25
-
26
-
27
-
28
-
29
-
30
-
31
-
32
-
33
-
34
-
35
-
36
-
37
-
38
-
39
-
40
-
41
-
42
-
43
-
44
-
45
-
46
-
47
-
48
-
49
-
50
-
51
-
52
-
53
-
54
-
55
-
56
-
57
-
58
-
59
-
60
-
61
-
62
-
63
-
64
-
65
-
66
-
67
-
68
-
69
-
70
-
71
-
72
-
73
-
74
-
75
-
76
-
77
-
78
-
79
-
80
-
81
-
82
-
83
-
84
-
85
-
86
-
87
-
88
-
89
-
90
-
91
-
92
-
93
-
94
-
95
-
96
-
97
-
98
-
99
-
100
-
101
-
102
-
103
-
104
-
105
-
106
-
107
-
108
-
109
-
110
-
111
-
112
-
113
-
114
-
115
-
116
-
117
-
118
-
119
-
120
-
121
-
122
-
123
-
124
-
125
-
126
-
127
-
128
-
129
-
130
-
131
-
132
-
133
-
134
-
135
-
136
-
137
-
138
-
139
-
140
-
141
-
142
-
143
-
144
-
145
-
146
-
147
-
148
-
149
-
150
-
151
-
152
-
153
-
154
-
155
-
156
-
157
-
158
-
159
-
160
-
161
-
162
-
163
-
164
-
165
-
166
-
167
-
168
-
169
-
170
-
171
-
172
-
173
-
174
-
175
-
176
-
177
-
178
-
179
-
180
-
181
-
182
-
183
-
184
-
185
-
186
-
187
-
188
-
189
-
190
-
191
-
192
-
193
-
194
-
195
-
196
-
197
-
198
-
199
-
200
-
201
-
 202
202 -
 203
203 -
 204
204 -
 205
205 -
 206
206 -
 207
207 -
 208
208 -
 209
209 -
 210
210 -
 211
211 -
 212
212 -
 213
213 -
 214
214 -
 215
215 -
 216
216 -
 217
217 -
 218
218 -
 219
219 -
 220
220 -
 221
221 -
 222
222 -
223
-
224
-
225
-
226
-
227
-
228
-
229
-
230
-
231
-
232
-
233
-
234
-
235
-
236
-
237
-
238
-
239
-
240
-
241
-
242
-
243
-
244
-
245
-
246
-
247
-
248
-
249
-
250
-
251
-
252
-
253
-
254
-
255
-
256
 |
 |

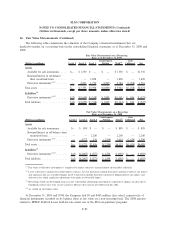
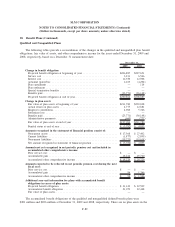
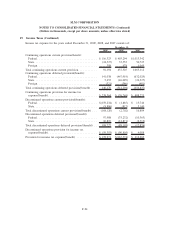
16. Fair Value Measurements (Continued)
The following table summarizes the fair values of the Company’s financial assets and liabilities, including
derivative financial instruments, as of December 31, 2009 and 2008.
(Dollars in millions)
Fair
Value
Carrying
Value Difference
Fair
Value
Carrying
Value Difference
December 31, 2009 December 31, 2008
Earning assets
FFELP loans ................. $119,747 $121,053 $(1,306) $107,319 $124,220 $(16,901)
Private Education Loans ......... 20,278 22,753 (2,475) 14,141 20,582 (6,441)
Other loans .................. 219 420 (201) 619 729 (110)
Cash and investments ........... 13,253 13,253 — 8,646 8,646 —
Total earning assets ............ 153,497 157,479 (3,982) 130,725 154,177 (23,452)
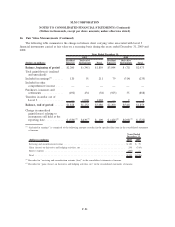
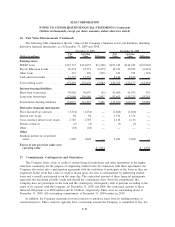
Interest-bearing liabilities
Short-term borrowings .......... 30,988 30,897 (91) 41,608 41,933 325
Long-term borrowings .......... 123,049 130,546 7,497 93,462 118,225 24,763
Total interest-bearing liabilities .... 154,037 161,443 7,406 135,070 160,158 25,088
Derivative financial instruments
Floor Income/Cap contracts ...... (1,234) (1,234) — (1,466) (1,466) —
Interest rate swaps ............. 94 94 — 1,374 1,374 —
Cross currency interest rate swaps. . 2,783 2,783 — 2,116 2,116 —
Futures contracts .............. (2) (2) — (3) (3) —
Other ....................... (18) (18) — — — —
Other
Residual interest in securitized
assets ..................... 1,828 1,828 — 2,200 2,200 —
Excess of net asset fair value over
carrying value .............. $3,424 $ 1,636
17. Commitments, Contingencies and Guarantees
The Company offers a line of credit to certain financial institutions and other institutions in the higher
education community for the purpose of originating student loans. In connection with these agreements, the
Company also enters into a participation agreement with the institution to participate in the loans as they are
originated. In the event that a line of credit is drawn upon, the loan is collateralized by underlying student
loans and is usually participated in on the same day. The contractual amount of these financial instruments
represents the maximum possible credit risk should the counterparty draw down the commitment, the
Company does not participate in the loan and the counterparty subsequently fails to perform according to the
terms of its contract with the Company. At December 31, 2009 and 2008, the contractual amount of these
financial obligations was $850 million and $1.0 billion, respectively. There were no outstanding draws at
December 31, 2009. All outstanding commitments at December 31, 2009 mature in 2010.
In addition, the Company maintains forward contracts to purchase loans from its lending partners at
contractual prices. These contracts typically have a maximum amount the Company is committed to buy, but
F-85
SLM CORPORATION
NOTES TO CONSOLIDATED FINANCIAL STATEMENTS (Continued)
(Dollars in thousands, except per share amounts, unless otherwise stated)