Sallie Mae 2009 Annual Report Download - page 219
Download and view the complete annual report
Please find page 219 of the 2009 Sallie Mae annual report below. You can navigate through the pages in the report by either clicking on the pages listed below, or by using the keyword search tool below to find specific information within the annual report.-
 1
1 -
2
-
3
-
4
-
5
-
6
-
7
-
8
-
9
-
10
-
11
-
12
-
13
-
14
-
15
-
16
-
17
-
18
-
19
-
20
-
21
-
22
-
23
-
24
-
25
-
26
-
27
-
28
-
29
-
30
-
31
-
32
-
33
-
34
-
35
-
36
-
37
-
38
-
39
-
40
-
41
-
42
-
43
-
44
-
45
-
46
-
47
-
48
-
49
-
50
-
51
-
52
-
53
-
54
-
55
-
56
-
57
-
58
-
59
-
60
-
61
-
62
-
63
-
64
-
65
-
66
-
67
-
68
-
69
-
70
-
71
-
72
-
73
-
74
-
75
-
76
-
77
-
78
-
79
-
80
-
81
-
82
-
83
-
84
-
85
-
86
-
87
-
88
-
89
-
90
-
91
-
92
-
93
-
94
-
95
-
96
-
97
-
98
-
99
-
100
-
101
-
102
-
103
-
104
-
105
-
106
-
107
-
108
-
109
-
110
-
111
-
112
-
113
-
114
-
115
-
116
-
117
-
118
-
119
-
120
-
121
-
122
-
123
-
124
-
125
-
126
-
127
-
128
-
129
-
130
-
131
-
132
-
133
-
134
-
135
-
136
-
137
-
138
-
139
-
140
-
141
-
142
-
143
-
144
-
145
-
146
-
147
-
148
-
149
-
150
-
151
-
152
-
153
-
154
-
155
-
156
-
157
-
158
-
159
-
160
-
161
-
162
-
163
-
164
-
165
-
166
-
167
-
168
-
169
-
170
-
171
-
172
-
173
-
174
-
175
-
176
-
177
-
178
-
179
-
180
-
181
-
182
-
183
-
184
-
185
-
186
-
187
-
188
-
189
-
190
-
191
-
192
-
193
-
194
-
195
-
196
-
197
-
198
-
199
-
200
-
201
-
202
-
203
-
204
-
205
-
206
-
207
-
208
-
 209
209 -
 210
210 -
 211
211 -
 212
212 -
 213
213 -
 214
214 -
 215
215 -
 216
216 -
 217
217 -
 218
218 -
 219
219 -
 220
220 -
 221
221 -
 222
222 -
 223
223 -
 224
224 -
 225
225 -
 226
226 -
 227
227 -
 228
228 -
 229
229 -
230
-
231
-
232
-
233
-
234
-
235
-
236
-
237
-
238
-
239
-
240
-
241
-
242
-
243
-
244
-
245
-
246
-
247
-
248
-
249
-
250
-
251
-
252
-
253
-
254
-
255
-
256
 |
 |

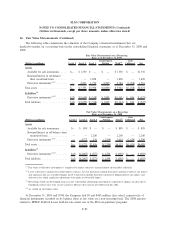
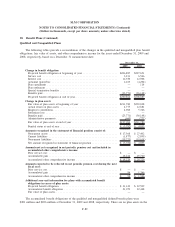
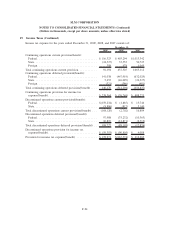
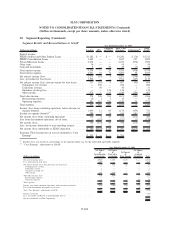
18. Benefit Plans (Continued)
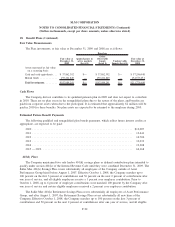
Fair Value Measurements
The Plan investments, at fair value at December 31, 2009 and 2008 are as follows:
Fair value at
December 31,
2009
Quoted prices in
active markets
(Level 1)
Other
Observable
Inputs
(Level 2)
Unobservable
Inputs (Level 3)
Fair value at
December 31,
2008
Based on
Assets measured at fair value
on a recurring basis:
Cash and cash equivalents . . . $ 37,862,392 $— $ 37,862,392 $— $ 57,206,048
Mutual funds . . . . . . . . . . . . 159,221,849 — 159,221,849 — 154,573,651
Total investments. . . . . . . . . $197,084,241 $— $197,084,241 $— $211,779,699
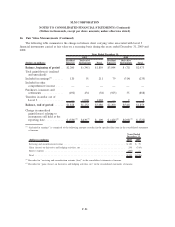
Cash Flows
The Company did not contribute to its qualified pension plan in 2009 and does not expect to contribute
in 2010. There are no plan assets in the nonqualified plans due to the nature of the plans, and benefits are
paid from corporate assets when due to the participant. It is estimated that approximately $2 million will be
paid in 2010 for these benefits. No plan assets are expected to be returned to the employer during 2010.
Estimated Future Benefit Payments
The following qualified and nonqualified plan benefit payments, which reflect future interest credits as
appropriate, are expected to be paid:
2010 ................................................................ $13,007
2011 ................................................................ 13,441
2012 ................................................................ 14,706
2013 ................................................................ 12,033
2014 ................................................................ 12,308
2015 — 2019 .......................................................... 66,168
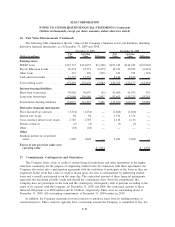
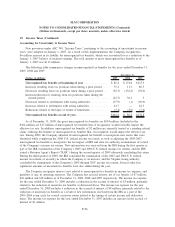
401(k) Plans
The Company maintained two safe harbor 401(k) savings plans as defined contribution plans intended to
qualify under section 401(k) of the Internal Revenue Code until they were combined December 31, 2009. The
Sallie Mae 401(k) Savings Plan covers substantially all employees of the Company outside of Asset
Performance Group hired before August 1, 2007. Effective October 1, 2008, the Company matches up to
100 percent on the first 3 percent of contributions and 50 percent on the next 2 percent of contributions after
one year of service, and all eligible employees receive a 1 percent core employer contribution. Prior to
October 1, 2008, up to 6 percent of employee contributions were matched 100 percent by the Company after
one year of service and certain eligible employees received a 2 percent core employer contribution.
The Sallie Mae 401(k) Retirement Savings Plan covers substantially all employees of Asset Performance
Group, and after August 1, 2007, the Retirement Savings Plan covers substantially all new hires of the
Company. Effective October 1, 2008, the Company matches up to 100 percent on the first 3 percent of
contributions and 50 percent on the next 2 percent of contributions after one year of service, and all eligible
F-92
SLM CORPORATION
NOTES TO CONSOLIDATED FINANCIAL STATEMENTS (Continued)
(Dollars in thousands, except per share amounts, unless otherwise stated)