Sallie Mae 2009 Annual Report Download - page 91
Download and view the complete annual report
Please find page 91 of the 2009 Sallie Mae annual report below. You can navigate through the pages in the report by either clicking on the pages listed below, or by using the keyword search tool below to find specific information within the annual report.-
 1
1 -
2
-
3
-
4
-
5
-
6
-
7
-
8
-
9
-
10
-
11
-
12
-
13
-
14
-
15
-
16
-
17
-
18
-
19
-
20
-
21
-
22
-
23
-
24
-
25
-
26
-
27
-
28
-
29
-
30
-
31
-
32
-
33
-
34
-
35
-
36
-
37
-
38
-
39
-
40
-
41
-
42
-
43
-
44
-
45
-
46
-
47
-
48
-
49
-
50
-
51
-
52
-
53
-
54
-
55
-
56
-
57
-
58
-
59
-
60
-
61
-
62
-
63
-
64
-
65
-
66
-
67
-
68
-
69
-
70
-
71
-
72
-
73
-
74
-
75
-
76
-
77
-
78
-
79
-
80
-
 81
81 -
 82
82 -
 83
83 -
 84
84 -
 85
85 -
 86
86 -
 87
87 -
 88
88 -
 89
89 -
 90
90 -
 91
91 -
 92
92 -
 93
93 -
 94
94 -
 95
95 -
 96
96 -
 97
97 -
 98
98 -
 99
99 -
 100
100 -
 101
101 -
102
-
103
-
104
-
105
-
106
-
107
-
108
-
109
-
110
-
111
-
112
-
113
-
114
-
115
-
116
-
117
-
118
-
119
-
120
-
121
-
122
-
123
-
124
-
125
-
126
-
127
-
128
-
129
-
130
-
131
-
132
-
133
-
134
-
135
-
136
-
137
-
138
-
139
-
140
-
141
-
142
-
143
-
144
-
145
-
146
-
147
-
148
-
149
-
150
-
151
-
152
-
153
-
154
-
155
-
156
-
157
-
158
-
159
-
160
-
161
-
162
-
163
-
164
-
165
-
166
-
167
-
168
-
169
-
170
-
171
-
172
-
173
-
174
-
175
-
176
-
177
-
178
-
179
-
180
-
181
-
182
-
183
-
184
-
185
-
186
-
187
-
188
-
189
-
190
-
191
-
192
-
193
-
194
-
195
-
196
-
197
-
198
-
199
-
200
-
201
-
202
-
203
-
204
-
205
-
206
-
207
-
208
-
209
-
210
-
211
-
212
-
213
-
214
-
215
-
216
-
217
-
218
-
219
-
220
-
221
-
222
-
223
-
224
-
225
-
226
-
227
-
228
-
229
-
230
-
231
-
232
-
233
-
234
-
235
-
236
-
237
-
238
-
239
-
240
-
241
-
242
-
243
-
244
-
245
-
246
-
247
-
248
-
249
-
250
-
251
-
252
-
253
-
254
-
255
-
256
 |
 |
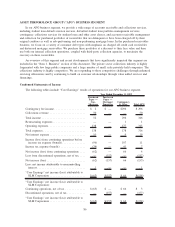
For the years ended December 31, 2009, 2008 and 2007, operating expenses for the APG Purchased
Paper — Non-Mortgage business totaled $138 million, $202 million and $164 million, respectively. The
decrease from the prior years is primarily due to lower collection costs due to the decreasing size of the
portfolio as a result of winding down the business.
At December 31, 2009 and 2008, the APG business segment had total assets of $1.1 billion and
$2.0 billion, respectively.
CORPORATE AND OTHER BUSINESS SEGMENT
Our Corporate and Other reportable segment reflects the aggregate activity of our smaller operating units,
including our Guarantor Servicing and Loan Servicing operating units, Upromise, other products and services,
as well as corporate expenses that do not pertain directly to our operating segments.
In our Guarantor Servicing operating unit, we provide a full complement of administrative services to
FFELP Guarantors, including guarantee issuance, processing, account maintenance and guarantee fulfillment.
In our Loan Servicing operating unit, we originate and service student loans on behalf of lenders, including
ED, who are unrelated to SLM Corporation. In our Upromise operating unit, we provide 529 college-savings
plan program management, transfer and servicing agent services, and administration services, and operate a
consumer savings network.
90