Sallie Mae 2009 Annual Report Download - page 43
Download and view the complete annual report
Please find page 43 of the 2009 Sallie Mae annual report below. You can navigate through the pages in the report by either clicking on the pages listed below, or by using the keyword search tool below to find specific information within the annual report.-
 1
1 -
2
-
3
-
4
-
5
-
6
-
7
-
8
-
9
-
10
-
11
-
12
-
13
-
14
-
15
-
16
-
17
-
18
-
19
-
20
-
21
-
22
-
23
-
24
-
25
-
26
-
27
-
28
-
29
-
30
-
31
-
32
-
 33
33 -
 34
34 -
 35
35 -
 36
36 -
 37
37 -
 38
38 -
 39
39 -
 40
40 -
 41
41 -
 42
42 -
 43
43 -
 44
44 -
 45
45 -
 46
46 -
 47
47 -
 48
48 -
 49
49 -
 50
50 -
 51
51 -
 52
52 -
 53
53 -
54
-
55
-
56
-
57
-
58
-
59
-
60
-
61
-
62
-
63
-
64
-
65
-
66
-
67
-
68
-
69
-
70
-
71
-
72
-
73
-
74
-
75
-
76
-
77
-
78
-
79
-
80
-
81
-
82
-
83
-
84
-
85
-
86
-
87
-
88
-
89
-
90
-
91
-
92
-
93
-
94
-
95
-
96
-
97
-
98
-
99
-
100
-
101
-
102
-
103
-
104
-
105
-
106
-
107
-
108
-
109
-
110
-
111
-
112
-
113
-
114
-
115
-
116
-
117
-
118
-
119
-
120
-
121
-
122
-
123
-
124
-
125
-
126
-
127
-
128
-
129
-
130
-
131
-
132
-
133
-
134
-
135
-
136
-
137
-
138
-
139
-
140
-
141
-
142
-
143
-
144
-
145
-
146
-
147
-
148
-
149
-
150
-
151
-
152
-
153
-
154
-
155
-
156
-
157
-
158
-
159
-
160
-
161
-
162
-
163
-
164
-
165
-
166
-
167
-
168
-
169
-
170
-
171
-
172
-
173
-
174
-
175
-
176
-
177
-
178
-
179
-
180
-
181
-
182
-
183
-
184
-
185
-
186
-
187
-
188
-
189
-
190
-
191
-
192
-
193
-
194
-
195
-
196
-
197
-
198
-
199
-
200
-
201
-
202
-
203
-
204
-
205
-
206
-
207
-
208
-
209
-
210
-
211
-
212
-
213
-
214
-
215
-
216
-
217
-
218
-
219
-
220
-
221
-
222
-
223
-
224
-
225
-
226
-
227
-
228
-
229
-
230
-
231
-
232
-
233
-
234
-
235
-
236
-
237
-
238
-
239
-
240
-
241
-
242
-
243
-
244
-
245
-
246
-
247
-
248
-
249
-
250
-
251
-
252
-
253
-
254
-
255
-
256
 |
 |

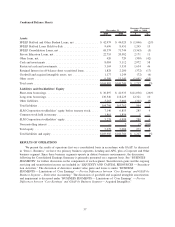
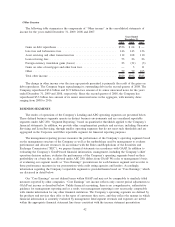
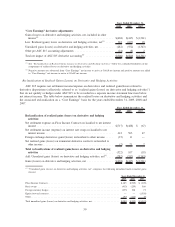
Other Income
The following table summarizes the components of “Other income” in the consolidated statements of
income for the years ended December 31, 2009, 2008 and 2007.
2009 2008 2007
Years Ended
December 31,
Gains on debt repurchases ...................................... $536 $ 64 $ —
Late fees and forbearance fees ................................... 146 143 136
Asset servicing and other transaction fees .......................... 112 108 110
Loan servicing fees ........................................... 53 26 26
Foreign currency translation gains (losses) .......................... 23 (31) (3)
Gains on sales of mortgages and other loan fees...................... — 3 11
Other ..................................................... 59 79 105
Total other income ........................................... $929 $392 $385
The change in other income over the year-ago periods presented is primarily the result of the gains on
debt repurchases. The Company began repurchasing its outstanding debt in the second quarter of 2008. The
Company repurchased $3.4 billion and $1.9 billion face amount of its senior unsecured notes for the years
ended December 31, 2009 and 2008, respectively. Since the second quarter of 2008, the Company has
repurchased $5.3 billion face amount of its senior unsecured notes in the aggregate, with maturity dates
ranging from 2008 to 2016.
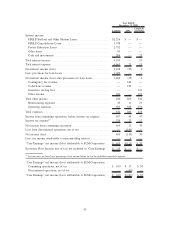
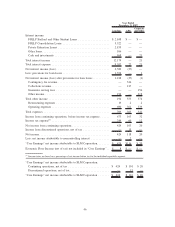
BUSINESS SEGMENTS
The results of operations of the Company’s Lending and APG operating segments are presented below.
These defined business segments operate in distinct business environments and are considered reportable
segments under ASC 280, “Segment Reporting,” based on quantitative thresholds applied to the Company’s
financial statements. In addition, we provide other complementary products and services, including Guarantor
Servicing and Loan Servicing, through smaller operating segments that do not meet such thresholds and are
aggregated in the Corporate and Other reportable segment for financial reporting purposes.
The management reporting process measures the performance of the Company’s operating segments based
on the management structure of the Company as well as the methodology used by management to evaluate
performance and allocate resources. In accordance with the Rules and Regulations of the Securities and
Exchange Commission (“SEC”), we prepare financial statements in accordance with GAAP. In addition to
evaluating the Company’s GAAP-based financial information, management, including the Company’s chief
operation decision makers, evaluates the performance of the Company’s operating segments based on their
profitability on a basis that, as allowed under ASC 280, differs from GAAP. We refer to management’s basis
of evaluating our segment results as “Core Earnings” presentations for each business segment and we refer to
these performance measures in our presentations with credit rating agencies and lenders. Accordingly,
information regarding the Company’s reportable segments is provided herein based on “Core Earnings,” which
are discussed in detail below.
Our “Core Earnings” are not defined terms within GAAP and may not be comparable to similarly titled
measures reported by other companies. “Core Earnings” net income reflects only current period adjustments to
GAAP net income as described below. Unlike financial accounting, there is no comprehensive, authoritative
guidance for management reporting and as a result, our management reporting is not necessarily comparable
with similar information for any other financial institution. The Company’s operating segments are defined by
the products and services they offer or the types of customers they serve, and they reflect the manner in which
financial information is currently evaluated by management. Intersegment revenues and expenses are netted
within the appropriate financial statement line items consistent with the income statement presentation
42