Sallie Mae 2009 Annual Report Download - page 218
Download and view the complete annual report
Please find page 218 of the 2009 Sallie Mae annual report below. You can navigate through the pages in the report by either clicking on the pages listed below, or by using the keyword search tool below to find specific information within the annual report.-
 1
1 -
2
-
3
-
4
-
5
-
6
-
7
-
8
-
9
-
10
-
11
-
12
-
13
-
14
-
15
-
16
-
17
-
18
-
19
-
20
-
21
-
22
-
23
-
24
-
25
-
26
-
27
-
28
-
29
-
30
-
31
-
32
-
33
-
34
-
35
-
36
-
37
-
38
-
39
-
40
-
41
-
42
-
43
-
44
-
45
-
46
-
47
-
48
-
49
-
50
-
51
-
52
-
53
-
54
-
55
-
56
-
57
-
58
-
59
-
60
-
61
-
62
-
63
-
64
-
65
-
66
-
67
-
68
-
69
-
70
-
71
-
72
-
73
-
74
-
75
-
76
-
77
-
78
-
79
-
80
-
81
-
82
-
83
-
84
-
85
-
86
-
87
-
88
-
89
-
90
-
91
-
92
-
93
-
94
-
95
-
96
-
97
-
98
-
99
-
100
-
101
-
102
-
103
-
104
-
105
-
106
-
107
-
108
-
109
-
110
-
111
-
112
-
113
-
114
-
115
-
116
-
117
-
118
-
119
-
120
-
121
-
122
-
123
-
124
-
125
-
126
-
127
-
128
-
129
-
130
-
131
-
132
-
133
-
134
-
135
-
136
-
137
-
138
-
139
-
140
-
141
-
142
-
143
-
144
-
145
-
146
-
147
-
148
-
149
-
150
-
151
-
152
-
153
-
154
-
155
-
156
-
157
-
158
-
159
-
160
-
161
-
162
-
163
-
164
-
165
-
166
-
167
-
168
-
169
-
170
-
171
-
172
-
173
-
174
-
175
-
176
-
177
-
178
-
179
-
180
-
181
-
182
-
183
-
184
-
185
-
186
-
187
-
188
-
189
-
190
-
191
-
192
-
193
-
194
-
195
-
196
-
197
-
198
-
199
-
200
-
201
-
202
-
203
-
204
-
205
-
206
-
207
-
 208
208 -
 209
209 -
 210
210 -
 211
211 -
 212
212 -
 213
213 -
 214
214 -
 215
215 -
 216
216 -
 217
217 -
 218
218 -
 219
219 -
 220
220 -
 221
221 -
 222
222 -
 223
223 -
 224
224 -
 225
225 -
 226
226 -
 227
227 -
 228
228 -
229
-
230
-
231
-
232
-
233
-
234
-
235
-
236
-
237
-
238
-
239
-
240
-
241
-
242
-
243
-
244
-
245
-
246
-
247
-
248
-
249
-
250
-
251
-
252
-
253
-
254
-
255
-
256
 |
 |

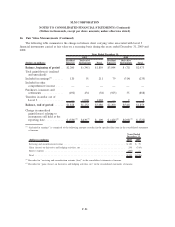
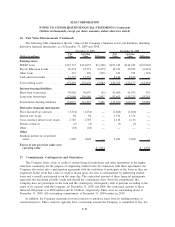
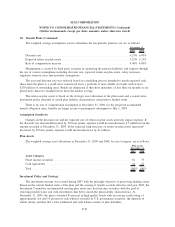
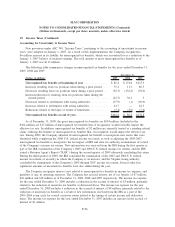
18. Benefit Plans (Continued)
The weighted average assumptions used to determine the net periodic pension cost are as follows:
2009 2008
December 31,
Discount rate....................................................... 6.25% 6.00%
Expected return on plan assets .......................................... 5.25% 5.25%
Rate of compensation increase .......................................... 4.00% 4.00%
Management is assisted by third party actuaries in measuring the pension liabilities and expense through
the use of various assumptions including discount rate, expected return on plan assets, salary increases,
employee turnover rates and mortality assumptions.
The year-end discount rate was selected based on a modeling process intended to match expected cash
flows from the plans to a yield curve constructed from a portfolio of non-callable Aa bonds with at least
$250 million of outstanding issue. Bonds are eliminated if they have maturities of less than six months or are
priced more than two standard errors from the market average.
The return on plan assets is based on the strategic asset allocation of the plan assets and a conservative
investment policy intended to match plan liability characteristics and preserve funded status.
There is no rate of compensation assumption at December 31, 2009, for the projected accumulated
benefit obligation since benefits no longer accrue to participants subsequent to July 1, 2009.
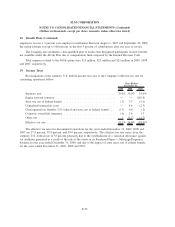
Assumption Sensitivity
Changes in the discount rate and the expected rate of return on plan assets inversely impact expense. If
the discount rate increased/decreased by 50 basis points, expense would decrease/increase $.7 million from the
amount recorded at December 31, 2009. If the expected long-term rate of return on plan assets increased/
decreased by 50 basis points, expense would decrease/increase by $1 million.
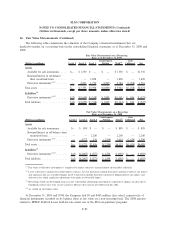
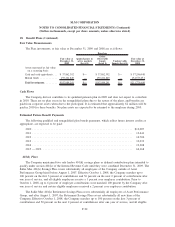
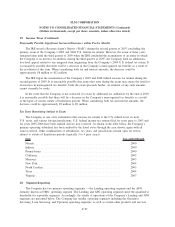
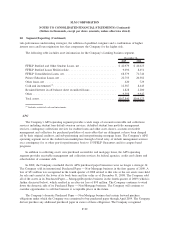
Plan Assets
The weighted average asset allocations at December 31, 2009 and 2008, by asset category, are as follows:
2009 2008
Plan Assets
December 31,
Asset Category
Fixed income securities ............................................... 81 73
Cash equivalents..................................................... 19 27
Total ............................................................. 100% 100%
Investment Policy and Strategy
The investment strategy was revised during 2007 with the principle objective of preserving funding status.
Based on the current funded status of the plan and the ceasing of benefit accruals effective mid-year 2009, the
Investment Committee recommended moving plan assets into fixed income securities with the goal of
removing funded status risk with investments that better match the plan liability characteristics. At
December 31, 2009, the plan is invested 81 percent in high quality bonds with an average credit rating of
approximately AA and 19 percent in cash which is invested in U.S. government securities, the duration of
which closely matches that of the traditional and cash balance nature of plan liabilities.
F-91
SLM CORPORATION
NOTES TO CONSOLIDATED FINANCIAL STATEMENTS (Continued)
(Dollars in thousands, except per share amounts, unless otherwise stated)