Sallie Mae 2009 Annual Report Download - page 204
Download and view the complete annual report
Please find page 204 of the 2009 Sallie Mae annual report below. You can navigate through the pages in the report by either clicking on the pages listed below, or by using the keyword search tool below to find specific information within the annual report.-
 1
1 -
2
-
3
-
4
-
5
-
6
-
7
-
8
-
9
-
10
-
11
-
12
-
13
-
14
-
15
-
16
-
17
-
18
-
19
-
20
-
21
-
22
-
23
-
24
-
25
-
26
-
27
-
28
-
29
-
30
-
31
-
32
-
33
-
34
-
35
-
36
-
37
-
38
-
39
-
40
-
41
-
42
-
43
-
44
-
45
-
46
-
47
-
48
-
49
-
50
-
51
-
52
-
53
-
54
-
55
-
56
-
57
-
58
-
59
-
60
-
61
-
62
-
63
-
64
-
65
-
66
-
67
-
68
-
69
-
70
-
71
-
72
-
73
-
74
-
75
-
76
-
77
-
78
-
79
-
80
-
81
-
82
-
83
-
84
-
85
-
86
-
87
-
88
-
89
-
90
-
91
-
92
-
93
-
94
-
95
-
96
-
97
-
98
-
99
-
100
-
101
-
102
-
103
-
104
-
105
-
106
-
107
-
108
-
109
-
110
-
111
-
112
-
113
-
114
-
115
-
116
-
117
-
118
-
119
-
120
-
121
-
122
-
123
-
124
-
125
-
126
-
127
-
128
-
129
-
130
-
131
-
132
-
133
-
134
-
135
-
136
-
137
-
138
-
139
-
140
-
141
-
142
-
143
-
144
-
145
-
146
-
147
-
148
-
149
-
150
-
151
-
152
-
153
-
154
-
155
-
156
-
157
-
158
-
159
-
160
-
161
-
162
-
163
-
164
-
165
-
166
-
167
-
168
-
169
-
170
-
171
-
172
-
173
-
174
-
175
-
176
-
177
-
178
-
179
-
180
-
181
-
182
-
183
-
184
-
185
-
186
-
187
-
188
-
189
-
190
-
191
-
192
-
193
-
 194
194 -
 195
195 -
 196
196 -
 197
197 -
 198
198 -
 199
199 -
 200
200 -
 201
201 -
 202
202 -
 203
203 -
 204
204 -
 205
205 -
 206
206 -
 207
207 -
 208
208 -
 209
209 -
 210
210 -
 211
211 -
 212
212 -
 213
213 -
 214
214 -
215
-
216
-
217
-
218
-
219
-
220
-
221
-
222
-
223
-
224
-
225
-
226
-
227
-
228
-
229
-
230
-
231
-
232
-
233
-
234
-
235
-
236
-
237
-
238
-
239
-
240
-
241
-
242
-
243
-
244
-
245
-
246
-
247
-
248
-
249
-
250
-
251
-
252
-
253
-
254
-
255
-
256
 |
 |

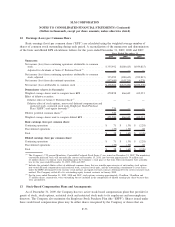
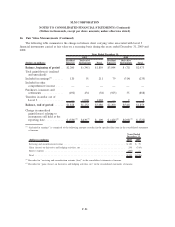
13. Stock-Based Compensation Plans and Arrangements (Continued)
The fair values of the stock purchase rights of the ESPP offerings in the years ended December 31, 2009,
2008 and 2007 were calculated using a Black-Scholes option pricing model with the following weighted
average assumptions.
2009 2008 2007
Years Ended December 31,
Risk-free interest rate ..................................... .53% 1.91% 4.97%
Expected volatility........................................ 103% 58% 23%
Expected dividend rate .................................... 0.00% 0.00% 2.19%
Expected life of the option. . . ............................... 1year 1 year 2 years
The expected volatility is based on implied volatility from publicly-traded options on the Company’s
stock at the grant date and historical volatility of the Company’s stock consistent with the expected life. The
risk-free interest rate is based on the U.S. Treasury spot rate at the grant date consistent with the expected life.
The dividend yield is based on the projected annual dividend payment per share based on the current dividend
amount at the grant date divided by the stock price at the grant date.
The weighted average fair value of the stock purchase rights of the ESPP offerings for the years ended
December 31, 2009, 2008 and 2007 was $4.88, $6.57 and $10.41, respectively. The fair values for 2009 and
2008 were amortized to compensation cost on a straight-line basis over a one-year vesting period. The fair
value for 2007 was amortized to compensation cost on a straight-line basis over a two-year vesting period. As
of December 31, 2009, there was $.1 million of unrecognized compensation cost related to the ESPP, which is
expected to be recognized in January 2010.
During the year ended December 31, 2007, plan participants purchased 215,058 shares of the Company’s
common stock. No shares were purchased in 2008 or 2009.
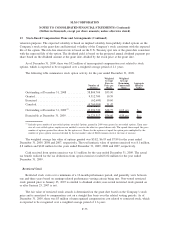
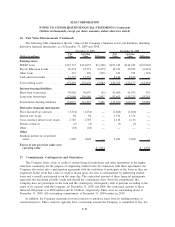
14. Other Income
The following table summarizes the components of “other income” in the consolidated statements of
income for the years ended December 31, 2009, 2008 and 2007.
2009 2008 2007
Years Ended December 31,
Gains on debt repurchases ............................ $536,190 $ 64,477 $ —
Late fees and forbearance fees ......................... 146,038 142,958 135,627
Asset servicing and other transaction fees ................. 112,162 108,292 110,215
Loan servicing fees ................................. 53,013 26,458 26,094
Foreign currency translation gains (losses), net ............. 22,956 (30,793) (2,952)
Other............................................ 58,791 80,684 116,091
Total other income .................................. $929,150 $392,076 $385,075
Gains on Debt Repurchases
The Company began actively repurchasing its outstanding debt in the second quarter of 2008. The
Company repurchased $3.4 billion and $1.9 billion face amount of its senior unsecured notes for the years
ended December 31, 2009 and 2008, respectively. Since the second quarter of 2008, the Company repurchased
F-77
SLM CORPORATION
NOTES TO CONSOLIDATED FINANCIAL STATEMENTS (Continued)
(Dollars in thousands, except per share amounts, unless otherwise stated)