Sallie Mae 2009 Annual Report Download - page 6
Download and view the complete annual report
Please find page 6 of the 2009 Sallie Mae annual report below. You can navigate through the pages in the report by either clicking on the pages listed below, or by using the keyword search tool below to find specific information within the annual report.-
 1
1 -
 2
2 -
 3
3 -
 4
4 -
 5
5 -
 6
6 -
 7
7 -
 8
8 -
 9
9 -
 10
10 -
 11
11 -
 12
12 -
 13
13 -
 14
14 -
 15
15 -
 16
16 -
 17
17 -
18
-
19
-
20
-
21
-
22
-
23
-
24
-
25
-
26
-
27
-
28
-
29
-
30
-
31
-
32
-
33
-
34
-
35
-
36
-
37
-
38
-
39
-
40
-
41
-
42
-
43
-
44
-
45
-
46
-
47
-
48
-
49
-
50
-
51
-
52
-
53
-
54
-
55
-
56
-
57
-
58
-
59
-
60
-
61
-
62
-
63
-
64
-
65
-
66
-
67
-
68
-
69
-
70
-
71
-
72
-
73
-
74
-
75
-
76
-
77
-
78
-
79
-
80
-
81
-
82
-
83
-
84
-
85
-
86
-
87
-
88
-
89
-
90
-
91
-
92
-
93
-
94
-
95
-
96
-
97
-
98
-
99
-
100
-
101
-
102
-
103
-
104
-
105
-
106
-
107
-
108
-
109
-
110
-
111
-
112
-
113
-
114
-
115
-
116
-
117
-
118
-
119
-
120
-
121
-
122
-
123
-
124
-
125
-
126
-
127
-
128
-
129
-
130
-
131
-
132
-
133
-
134
-
135
-
136
-
137
-
138
-
139
-
140
-
141
-
142
-
143
-
144
-
145
-
146
-
147
-
148
-
149
-
150
-
151
-
152
-
153
-
154
-
155
-
156
-
157
-
158
-
159
-
160
-
161
-
162
-
163
-
164
-
165
-
166
-
167
-
168
-
169
-
170
-
171
-
172
-
173
-
174
-
175
-
176
-
177
-
178
-
179
-
180
-
181
-
182
-
183
-
184
-
185
-
186
-
187
-
188
-
189
-
190
-
191
-
192
-
193
-
194
-
195
-
196
-
197
-
198
-
199
-
200
-
201
-
202
-
203
-
204
-
205
-
206
-
207
-
208
-
209
-
210
-
211
-
212
-
213
-
214
-
215
-
216
-
217
-
218
-
219
-
220
-
221
-
222
-
223
-
224
-
225
-
226
-
227
-
228
-
229
-
230
-
231
-
232
-
233
-
234
-
235
-
236
-
237
-
238
-
239
-
240
-
241
-
242
-
243
-
244
-
245
-
246
-
247
-
248
-
249
-
250
-
251
-
252
-
253
-
254
-
255
-
256
 |
 |

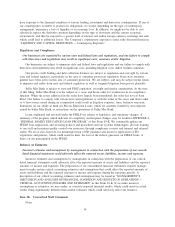
According to the College Board, tuition and fees at four-year public institutions and four-year private
institutions have increased 88 percent and 66 percent, respectively, in constant, inflation-adjusted dollars, since
AY 1999-2000. Under the FFELP, there are limits to the amount students can borrow each academic year. The
first loan limit increases since 1992 were implemented July 1, 2007. In response to the credit crisis, Congress
significantly increased loan limits again in 2008. As a result, students rely more on federal loans to fund their
tuition needs. Both federal and private loans as a percentage of total student aid were 49 percent of total
student aid in AY 1998-1999 and 53 percent in AY 2008-2009. Private Education Loans accounted for
12 percent of total student loans — both federally guaranteed and Private Education Loans — in AY
2008-2009, compared to 8 percent in AY 1998-1999.
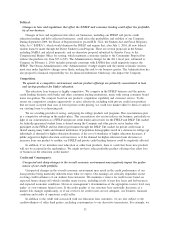
The National Center for Education Statistics predicts that the college-age population will increase
approximately 10 percent from 2009 to 2018. Demand for education credit is expected to increase due to this
population demographic, first-time college enrollments of older students and continuing interest in adult
education.
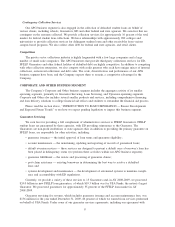
The following charts show the historical and projected enrollment and average tuition and fee growth for
four-year public and private colleges and universities.
Historical and Projected Enrollment
(in millions)
17.3 17.5 17.8 18.2 18.7 19.1
19.0 19.3 19.5 19.7 19.9 20.1 20.3 20.4 20.6
16.9
16.6
0
3
6
9
12
15
18
21
2002 2005 2008 2011 2014 2017
Source: National Center for Education Statistics
Note: Total enrollment in all degree-granting institutions; middle alternative projections for 2006 onward.
Cost of Attendance
(1)
Cumulative % Increase from AY 1998-1999
Tution & Fees 4-Year Public Tution & Fees 4-Year Private
0%
20%
40%
60%
80%
100%
2009
2008
2007
2006
2005
2004
2003
2002
2001
2000
Source: The College Board
(1)
Cost of attendance is in current dollars and includes
tuition, fees and on-campus room and board.
5