Sallie Mae 2009 Annual Report Download - page 79
Download and view the complete annual report
Please find page 79 of the 2009 Sallie Mae annual report below. You can navigate through the pages in the report by either clicking on the pages listed below, or by using the keyword search tool below to find specific information within the annual report.-
 1
1 -
2
-
3
-
4
-
5
-
6
-
7
-
8
-
9
-
10
-
11
-
12
-
13
-
14
-
15
-
16
-
17
-
18
-
19
-
20
-
21
-
22
-
23
-
24
-
25
-
26
-
27
-
28
-
29
-
30
-
31
-
32
-
33
-
34
-
35
-
36
-
37
-
38
-
39
-
40
-
41
-
42
-
43
-
44
-
45
-
46
-
47
-
48
-
49
-
50
-
51
-
52
-
53
-
54
-
55
-
56
-
57
-
58
-
59
-
60
-
61
-
62
-
63
-
64
-
65
-
66
-
67
-
68
-
 69
69 -
 70
70 -
 71
71 -
 72
72 -
 73
73 -
 74
74 -
 75
75 -
 76
76 -
 77
77 -
 78
78 -
 79
79 -
 80
80 -
 81
81 -
 82
82 -
 83
83 -
 84
84 -
 85
85 -
 86
86 -
 87
87 -
 88
88 -
 89
89 -
90
-
91
-
92
-
93
-
94
-
95
-
96
-
97
-
98
-
99
-
100
-
101
-
102
-
103
-
104
-
105
-
106
-
107
-
108
-
109
-
110
-
111
-
112
-
113
-
114
-
115
-
116
-
117
-
118
-
119
-
120
-
121
-
122
-
123
-
124
-
125
-
126
-
127
-
128
-
129
-
130
-
131
-
132
-
133
-
134
-
135
-
136
-
137
-
138
-
139
-
140
-
141
-
142
-
143
-
144
-
145
-
146
-
147
-
148
-
149
-
150
-
151
-
152
-
153
-
154
-
155
-
156
-
157
-
158
-
159
-
160
-
161
-
162
-
163
-
164
-
165
-
166
-
167
-
168
-
169
-
170
-
171
-
172
-
173
-
174
-
175
-
176
-
177
-
178
-
179
-
180
-
181
-
182
-
183
-
184
-
185
-
186
-
187
-
188
-
189
-
190
-
191
-
192
-
193
-
194
-
195
-
196
-
197
-
198
-
199
-
200
-
201
-
202
-
203
-
204
-
205
-
206
-
207
-
208
-
209
-
210
-
211
-
212
-
213
-
214
-
215
-
216
-
217
-
218
-
219
-
220
-
221
-
222
-
223
-
224
-
225
-
226
-
227
-
228
-
229
-
230
-
231
-
232
-
233
-
234
-
235
-
236
-
237
-
238
-
239
-
240
-
241
-
242
-
243
-
244
-
245
-
246
-
247
-
248
-
249
-
250
-
251
-
252
-
253
-
254
-
255
-
256
 |
 |

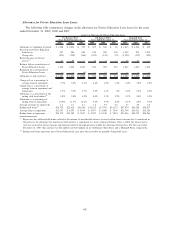
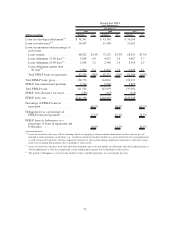
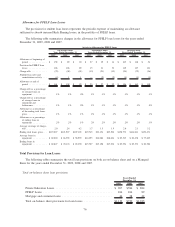
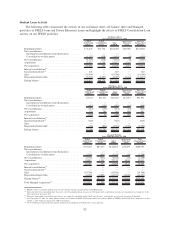
Receivable for Partially Charged-Off Private Education Loans
The Company charges off the estimated loss of a defaulted loan balance. Actual recoveries are applied
against the remaining loan balance that was not charged off. We refer to this remaining loan balance as the
“receivable for partially charged-off loans.” If actual periodic recoveries are less than expected, the difference
is charged off and immediately included in provision expense.
The following tables summarize the activity in the receivable for partially charged-off loans (see
“Allowance for Private Education Loan Losses,” above, for a further discussion) for the years ended
December 31, 2009, 2008 and 2007.
2009 2008 2007 2009 2008 2007 2009 2008 2007
Years Ended
December 31,
On-Balance Sheet
Years Ended
December 31,
Off-Balance Sheet
Years Ended
December 31,
Managed Basis
Activity in Receivable for Partially Charged-Off Loans
Receivable at beginning of period . . . . . . . . . . . . . . . . . . $222 $118 $ 64 $ 92 $28 $— $314 $146 $ 64
Expected future recoveries of current period defaults
(1)
. . . 320 140 86 154 72 28 474 212 114
Recoveries . . . . . . . . . . . . . . . . . . . . . . . . . . . . . . . . . . (43) (36) (32) (17) (8) — (60) (44) (32)
Receivable at end of period . . . . . . . . . . . . . . . . . . . . . . $499 $222 $118 $229 $92 $28 $728 $314 $146
(1)
Net of any current period recoveries that were less than expected.
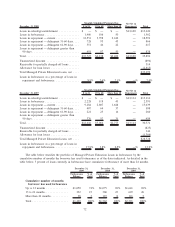
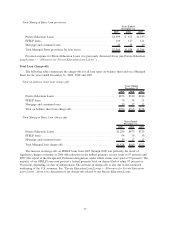
Student Loan Acquisitions
The following tables summarize the components of our student loan acquisition activity for the years
ended December 31, 2009, 2008 and 2007.
FFELP Private Total
Year Ended
December 31, 2009
Internal lending brands and Lender Partners ................... $22,375 $3,394 $25,769
Other commitment clients ................................ 347 — 347
Spot purchases ........................................ 1,523 — 1,523
Consolidations and clean-up calls of off-balance sheet securitized
loans .............................................. 3,376 797 4,173
Capitalized interest, premiums and discounts .................. 2,583 949 3,532
Total on-balance sheet student loan acquisitions ................ 30,204 5,140 35,344
Consolidations and clean-up calls of off-balance sheet securitized
loans .............................................. (3,376) (797) (4,173)
Capitalized interest, premiums and discounts — off-balance sheet
securitized loans ..................................... 342 498 840
Total Managed student loan acquisitions...................... $27,170 $4,841 $32,011
78