Sallie Mae 2009 Annual Report Download - page 42
Download and view the complete annual report
Please find page 42 of the 2009 Sallie Mae annual report below. You can navigate through the pages in the report by either clicking on the pages listed below, or by using the keyword search tool below to find specific information within the annual report.-
 1
1 -
2
-
3
-
4
-
5
-
6
-
7
-
8
-
9
-
10
-
11
-
12
-
13
-
14
-
15
-
16
-
17
-
18
-
19
-
20
-
21
-
22
-
23
-
24
-
25
-
26
-
27
-
28
-
29
-
30
-
31
-
 32
32 -
 33
33 -
 34
34 -
 35
35 -
 36
36 -
 37
37 -
 38
38 -
 39
39 -
 40
40 -
 41
41 -
 42
42 -
 43
43 -
 44
44 -
 45
45 -
 46
46 -
 47
47 -
 48
48 -
 49
49 -
 50
50 -
 51
51 -
 52
52 -
53
-
54
-
55
-
56
-
57
-
58
-
59
-
60
-
61
-
62
-
63
-
64
-
65
-
66
-
67
-
68
-
69
-
70
-
71
-
72
-
73
-
74
-
75
-
76
-
77
-
78
-
79
-
80
-
81
-
82
-
83
-
84
-
85
-
86
-
87
-
88
-
89
-
90
-
91
-
92
-
93
-
94
-
95
-
96
-
97
-
98
-
99
-
100
-
101
-
102
-
103
-
104
-
105
-
106
-
107
-
108
-
109
-
110
-
111
-
112
-
113
-
114
-
115
-
116
-
117
-
118
-
119
-
120
-
121
-
122
-
123
-
124
-
125
-
126
-
127
-
128
-
129
-
130
-
131
-
132
-
133
-
134
-
135
-
136
-
137
-
138
-
139
-
140
-
141
-
142
-
143
-
144
-
145
-
146
-
147
-
148
-
149
-
150
-
151
-
152
-
153
-
154
-
155
-
156
-
157
-
158
-
159
-
160
-
161
-
162
-
163
-
164
-
165
-
166
-
167
-
168
-
169
-
170
-
171
-
172
-
173
-
174
-
175
-
176
-
177
-
178
-
179
-
180
-
181
-
182
-
183
-
184
-
185
-
186
-
187
-
188
-
189
-
190
-
191
-
192
-
193
-
194
-
195
-
196
-
197
-
198
-
199
-
200
-
201
-
202
-
203
-
204
-
205
-
206
-
207
-
208
-
209
-
210
-
211
-
212
-
213
-
214
-
215
-
216
-
217
-
218
-
219
-
220
-
221
-
222
-
223
-
224
-
225
-
226
-
227
-
228
-
229
-
230
-
231
-
232
-
233
-
234
-
235
-
236
-
237
-
238
-
239
-
240
-
241
-
242
-
243
-
244
-
245
-
246
-
247
-
248
-
249
-
250
-
251
-
252
-
253
-
254
-
255
-
256
 |
 |
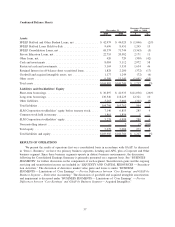
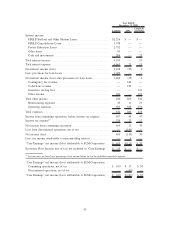
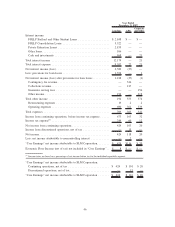
Net interest income after provisions for loan losses increased by $72 million in the year ended
December 31, 2008 from the prior year. This increase was due to a $295 million decrease in provisions for
loan losses, offset by a $223 million decrease in net interest income. The decrease in net interest income was
primarily due to a decrease in the student loan spread (see “LENDING BUSINESS SEGMENT — Net Interest
Income — Net Interest Margin — On-Balance Sheet”) and an increase in the 2008 Asset-Backed Financing
Facilities Fees, partially offset by a $25 billion increase in the average balance of on-balance sheet student
loans. The decrease in provisions for loan losses relates to the higher provision amounts in the fourth quarter
of 2007 for Private Education Loans, FFELP loans and mortgage loans, primarily due to a weakening
U.S. economy. The significant provision in the fourth quarter of 2007 primarily related to the non-traditional
portfolio which was particularly impacted by the weakening U.S. economy (see “LENDING BUSINESS
SEGMENT — Private Education Loan Losses — Private Education Loan Delinquencies and Forbearance”
and “— Allowance for Private Education Loan Losses”).
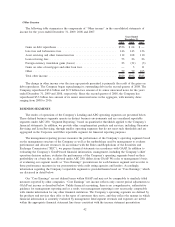
For the year ended December 31, 2008, contingency fee, collections and guarantor servicing fee revenue
totaled $589 million, a $123 million decrease from $712 million in the prior year. This decrease was primarily
the result of $111 million of impairment related to our non-mortgage purchased paper subsidiary recorded in
2008 compared to $17 million in 2007. The increase in impairment is a result of the impact of the economy
on the ability to collect on these assets (see “ASSET PERFORMANCE GROUP BUSINESS SEGMENT”).
Losses on loans and securities, net, totaled $186 million for the year ended December 31, 2008, a
$91 million increase from $95 million incurred in the year ended December 31, 2007. Prior to the fourth
quarter of 2008, these losses were primarily the result of our repurchase of delinquent Private Education Loans
from our off-balance sheet securitization trusts. When Private Education Loans in our off-balance sheet
securitization trusts that settled before September 30, 2005 became 180 days delinquent, we previously
exercised our contingent call option to repurchase these loans at par value out of the trusts and recorded a loss
for the difference in the par value paid and the fair market value of the loans at the time of purchase. We do
not hold the contingent call option for any trusts that settled after September 30, 2005. Beginning in October
2008, we decided to no longer exercise our contingent call option. The loss in the fourth quarter of 2008
primarily relates to the sale of approximately $1.0 billion FFELP loans to ED under the ECASLA, which
resulted in a $53 million loss. See “LIQUIDITY AND CAPITAL RESOURCES — ED Funding Programs” for
a further discussion.
Restructuring expenses of $83 million and $23 million were recognized in the years ended December 31,
2008 and 2007, respectively, as previously discussed.
Operating expenses totaled $1.3 billion and $1.5 billion for the years ended December 31, 2008 and
2007, respectively. The year-over-year reduction is primarily due to our cost reduction efforts discussed above.
Of these amounts, $86 million and $98 million, respectively, relate to amortization and impairment of goodwill
and intangible assets for continuing operations.
Income tax (benefit) from continuing operations was $(76) million in the year ended December 31, 2008
compared to income tax expense of $408 million in the prior year resulting in effective tax rates of 54 percent
and (83) percent. The movement in the effective tax rate in 2008 compared with the prior year was primarily
driven by the permanent tax impact of excluding non-taxable gains and losses on equity forward contracts
which were marked to market through earnings under ASC 815 in 2007. Also contributing to the movement
was the impact of significantly lower reported pre-tax loss in 2008 and the resulting changes in the proportion
of income subject to federal and state taxes. For additional information, see Note 19, “Income Taxes,” to the
consolidated financial statements.
Net loss attributable to SLM Corporation from discontinued operations was $143 million for the year
ended December 31, 2008, compared to net income of $6 million for the prior year. As discussed above, the
Company sold all of the assets in its Purchased Paper — Mortgage/Properties business in the fourth quarter of
2009. In 2008, the Company incurred $161 million of after-tax asset impairments associated with this business
line compared to the prior year, during which the Company incurred $2 million of after-tax asset impairments.
41