Sallie Mae 2009 Annual Report Download - page 136
Download and view the complete annual report
Please find page 136 of the 2009 Sallie Mae annual report below. You can navigate through the pages in the report by either clicking on the pages listed below, or by using the keyword search tool below to find specific information within the annual report.-
 1
1 -
2
-
3
-
4
-
5
-
6
-
7
-
8
-
9
-
10
-
11
-
12
-
13
-
14
-
15
-
16
-
17
-
18
-
19
-
20
-
21
-
22
-
23
-
24
-
25
-
26
-
27
-
28
-
29
-
30
-
31
-
32
-
33
-
34
-
35
-
36
-
37
-
38
-
39
-
40
-
41
-
42
-
43
-
44
-
45
-
46
-
47
-
48
-
49
-
50
-
51
-
52
-
53
-
54
-
55
-
56
-
57
-
58
-
59
-
60
-
61
-
62
-
63
-
64
-
65
-
66
-
67
-
68
-
69
-
70
-
71
-
72
-
73
-
74
-
75
-
76
-
77
-
78
-
79
-
80
-
81
-
82
-
83
-
84
-
85
-
86
-
87
-
88
-
89
-
90
-
91
-
92
-
93
-
94
-
95
-
96
-
97
-
98
-
99
-
100
-
101
-
102
-
103
-
104
-
105
-
106
-
107
-
108
-
109
-
110
-
111
-
112
-
113
-
114
-
115
-
116
-
117
-
118
-
119
-
120
-
121
-
122
-
123
-
124
-
125
-
 126
126 -
 127
127 -
 128
128 -
 129
129 -
 130
130 -
 131
131 -
 132
132 -
 133
133 -
 134
134 -
 135
135 -
 136
136 -
 137
137 -
 138
138 -
 139
139 -
 140
140 -
 141
141 -
 142
142 -
 143
143 -
 144
144 -
 145
145 -
 146
146 -
147
-
148
-
149
-
150
-
151
-
152
-
153
-
154
-
155
-
156
-
157
-
158
-
159
-
160
-
161
-
162
-
163
-
164
-
165
-
166
-
167
-
168
-
169
-
170
-
171
-
172
-
173
-
174
-
175
-
176
-
177
-
178
-
179
-
180
-
181
-
182
-
183
-
184
-
185
-
186
-
187
-
188
-
189
-
190
-
191
-
192
-
193
-
194
-
195
-
196
-
197
-
198
-
199
-
200
-
201
-
202
-
203
-
204
-
205
-
206
-
207
-
208
-
209
-
210
-
211
-
212
-
213
-
214
-
215
-
216
-
217
-
218
-
219
-
220
-
221
-
222
-
223
-
224
-
225
-
226
-
227
-
228
-
229
-
230
-
231
-
232
-
233
-
234
-
235
-
236
-
237
-
238
-
239
-
240
-
241
-
242
-
243
-
244
-
245
-
246
-
247
-
248
-
249
-
250
-
251
-
252
-
253
-
254
-
255
-
256
 |
 |

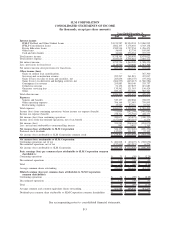
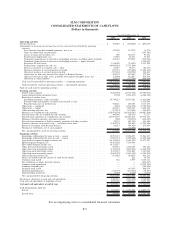
SLM CORPORATION
CONSOLIDATED STATEMENTS OF CASH FLOWS
(Dollars in thousands)
2009 2008 2007
Years Ended December 31,
Operating activities
Net income (loss) .................................................. $ 324,985 $ (208,694) $ (894,079)
Adjustments to reconcile net income (loss) to net cash (used in) provided by operating
activities:
Loss (income) from discontinued operations, net of tax ....................... 157,690 143,219 (6,276)
Gains on student loan securitizations ................................... — — (367,300)
Losses on loans and securities, net .................................... 580 186,155 95,492
Stock-based compensation cost ...................................... 51,065 86,271 74,621
Unrealized (gains)/losses on derivative and hedging activities, excluding equity forwards . . 324,443 559,895 (214,963)
Unrealized (gains)/losses on derivative and hedging activities — equity forwards ....... — — 1,558,025
Provisions for loan losses .......................................... 1,118,960 719,650 1,015,308
Student loans originated for sale, net ................................... (19,099,583) (7,787,869) —
Decrease (increase) in restricted cash — other ............................. 40,051 96,617 (84,537)
Decrease (increase) in accrued interest receivable ........................... 893,516 (279,082) (1,046,124)
(Decrease) increase in accrued interest payable ............................ (517,401) (200,501) 214,401
Adjustment for non-cash (income)/loss related to Retained Interest ................ 329,953 425,462 279,246
(Increase) decrease in other assets, goodwill and acquired intangible assets, net ........ (23,405) 421,667 836,564
(Decrease) in other liabilities ........................................ (29,276) (155,768) (890,464)
Cash (used in) provided by operating activities — continuing operations .............. (16,753,407) (5,784,284) 1,463,993
Cash provided by (used in) operating activities — discontinued operations ............. 514,713 301,234 (618,117)
Total net cash (used in) operating activities .................................. (15,913,709) (5,691,744) (48,203)
Investing activities
Student loans acquired ............................................. (9,403,093) (23,337,946) (39,303,005)
Loans purchased from securitized trusts .................................. (5,978) (1,243,671) (4,448,766)
Reduction of student loans:
Installment payments, claims and other ................................. 10,749,227 10,333,901 11,413,044
Proceeds from securitization of student loans treated as sales .................... — — 1,976,599
Proceeds from sales of student loans ................................... 788,221 496,183 1,013,295
Other loans — originated ............................................ (2,823) (1,138,355) (3,396,501)
Other loans — repaid .............................................. 261,491 1,542,307 3,420,187
Other investing activities, net ......................................... (573,251) (135,041) (358,209)
Purchases of available-for-sale securities .................................. (128,478,198) (101,140,587) (90,087,504)
Proceeds from sales of available-for-sale securities ............................ 100,056 328,530 73,217
Proceeds from maturities of available-for-sale securities ........................ 127,951,879 102,436,912 89,353,103
Purchases of held-to-maturity and other securities ............................ (889) (500,255) (330,450)
Proceeds from maturities of held-to-maturity securities and other securities ............ 79,171 407,180 435,468
(Increase) decrease in restricted cash — on-balance sheet trusts .................... (1,181,275) 918,403 (1,293,846)
Return of investment from Retained Interest ................................ 26,513 403,020 276,996
Purchase of subsidiaries, net of cash acquired ............................... — (37,868) —
Net cash provided by (used in) investing activities ............................ 311,051 (10,667,287) (31,256,372)
Financing activities
Borrowings collateralized by loans in trust — issued ........................... 12,997,915 17,986,955 23,943,837
Borrowings collateralized by loans in trust — repaid ........................... (5,689,713) (6,299,483) (6,429,648)
Asset-backed commercial paper conduits, net ............................... (16,138,186) (1,649,287) 21,073,857
ED Participation Program, net......................................... 19,301,929 7,364,969 —
ED Conduit Program facility, net ....................................... 14,313,837 — —
Other short-term borrowings issued ..................................... 298,294 2,592,429 594,434
Other short-term borrowings repaid ..................................... (1,434,538) (1,512,031) (2,342,953)
Other long-term borrowings issued ...................................... 4,333,181 3,563,003 1,567,602
Other long-term borrowings repaid ...................................... (9,504,267) (9,518,655) (3,188,249)
Other financing activities, net ......................................... (751,087) 284,659 901,263
Excess tax benefit from the exercise of stock-based awards ...................... — 281 30,316
Common stock issued .............................................. 664 5,979 2,125,111
Net settlements on equity forward contracts ................................ — — (614,217)
Common stock repurchased .......................................... — — (2,222,394)
Common dividends paid ............................................ — — (102,658)
Preferred stock issued .............................................. — 145,345 968,674
Preferred dividends paid ............................................ (115,775) (110,556) (36,497)
Noncontrolling interest,net ........................................... (9,585) (6,606) (3,094)
Net cash provided by financing activities .................................. 17,602,669 12,847,002 36,265,384
Net increase (decrease) in cash and cash equivalents ............................ 2,000,011 (3,512,029) 4,960,809
Cash and cash equivalents at beginning of year ............................... 4,070,002 7,582,031 2,621,222
Cash and cash equivalents at end of year .................................. $ 6,070,013 $ 4,070,002 $ 7,582,031
Cash disbursements made for:
Interest ....................................................... $ 3,656,545 $ 6,157,096 $ 6,897,773
Income taxes ................................................... $ 298,285 $ 699,364 $ 1,097,340
See accompanying notes to consolidated financial statements.
F-9