Sallie Mae 2009 Annual Report Download - page 131
Download and view the complete annual report
Please find page 131 of the 2009 Sallie Mae annual report below. You can navigate through the pages in the report by either clicking on the pages listed below, or by using the keyword search tool below to find specific information within the annual report.-
 1
1 -
2
-
3
-
4
-
5
-
6
-
7
-
8
-
9
-
10
-
11
-
12
-
13
-
14
-
15
-
16
-
17
-
18
-
19
-
20
-
21
-
22
-
23
-
24
-
25
-
26
-
27
-
28
-
29
-
30
-
31
-
32
-
33
-
34
-
35
-
36
-
37
-
38
-
39
-
40
-
41
-
42
-
43
-
44
-
45
-
46
-
47
-
48
-
49
-
50
-
51
-
52
-
53
-
54
-
55
-
56
-
57
-
58
-
59
-
60
-
61
-
62
-
63
-
64
-
65
-
66
-
67
-
68
-
69
-
70
-
71
-
72
-
73
-
74
-
75
-
76
-
77
-
78
-
79
-
80
-
81
-
82
-
83
-
84
-
85
-
86
-
87
-
88
-
89
-
90
-
91
-
92
-
93
-
94
-
95
-
96
-
97
-
98
-
99
-
100
-
101
-
102
-
103
-
104
-
105
-
106
-
107
-
108
-
109
-
110
-
111
-
112
-
113
-
114
-
115
-
116
-
117
-
118
-
119
-
120
-
 121
121 -
 122
122 -
 123
123 -
 124
124 -
 125
125 -
 126
126 -
 127
127 -
 128
128 -
 129
129 -
 130
130 -
 131
131 -
 132
132 -
 133
133 -
 134
134 -
 135
135 -
 136
136 -
 137
137 -
 138
138 -
 139
139 -
 140
140 -
 141
141 -
142
-
143
-
144
-
145
-
146
-
147
-
148
-
149
-
150
-
151
-
152
-
153
-
154
-
155
-
156
-
157
-
158
-
159
-
160
-
161
-
162
-
163
-
164
-
165
-
166
-
167
-
168
-
169
-
170
-
171
-
172
-
173
-
174
-
175
-
176
-
177
-
178
-
179
-
180
-
181
-
182
-
183
-
184
-
185
-
186
-
187
-
188
-
189
-
190
-
191
-
192
-
193
-
194
-
195
-
196
-
197
-
198
-
199
-
200
-
201
-
202
-
203
-
204
-
205
-
206
-
207
-
208
-
209
-
210
-
211
-
212
-
213
-
214
-
215
-
216
-
217
-
218
-
219
-
220
-
221
-
222
-
223
-
224
-
225
-
226
-
227
-
228
-
229
-
230
-
231
-
232
-
233
-
234
-
235
-
236
-
237
-
238
-
239
-
240
-
241
-
242
-
243
-
244
-
245
-
246
-
247
-
248
-
249
-
250
-
251
-
252
-
253
-
254
-
255
-
256
 |
 |

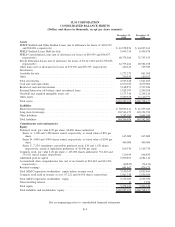
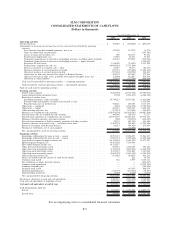
SLM CORPORATION
CONSOLIDATED BALANCE SHEETS
(Dollars and shares in thousands, except per share amounts)
December 31,
2009
December 31,
2008
Assets
FFELP Stafford and Other Student Loans (net of allowance for losses of $104,219
and $90,906, respectively) . ....................................... $ 42,978,874 $ 44,025,361
FFELP Stafford Loans Held-for-Sale . ................................. 9,695,714 8,450,976
FFELP Consolidation Loans (net of allowance for losses of $56,949 and $46,637,
respectively) . ................................................. 68,378,560 71,743,435
Private Education Loans (net of allowance for losses of $1,443,440 and $1,308,043,
respectively) . ................................................. 22,753,462 20,582,298
Other loans (net of allowance for losses of $73,985 and $58,395, respectively) . . . . 420,233 729,380
Investments
Available-for-sale ................................................ 1,273,275 861,008
Other . . ....................................................... 740,553 180,397
Total investments ................................................ 2,013,828 1,041,405
Cash and cash equivalents . . . ....................................... 6,070,013 4,070,002
Restricted cash and investments ...................................... 5,168,871 3,535,286
Retained Interest in off-balance sheet securitized loans ..................... 1,828,075 2,200,298
Goodwill and acquired intangible assets, net . ............................ 1,177,310 1,249,219
Other assets . . . ................................................. 9,500,358 11,140,777
Total assets ..................................................... $169,985,298 $168,768,437
Liabilities
Short-term borrowings . ............................................ $ 30,896,811 $ 41,933,043
Long-term borrowings . ............................................ 130,546,272 118,224,794
Other liabilities . ................................................. 3,263,593 3,604,260
Total liabilities . ................................................. 164,706,676 163,762,097
Commitments and contingencies
Equity
Preferred stock, par value $.20 per share, 20,000 shares authorized
Series A: 3,300 and 3,300 shares issued, respectively, at stated value of $50 per
share ...................................................... 165,000 165,000
Series B: 4,000 and 4,000 shares issued, respectively, at stated value of $100 per
share ...................................................... 400,000 400,000
Series C, 7.25% mandatory convertible preferred stock; 810 and 1,150 shares,
respectively, issued at liquidation preference of $1,000 per share ........... 810,370 1,149,770
Common stock, par value $.20 per share, 1,125,000 shares authorized: 552,220 and
534,411 shares issued, respectively . ................................. 110,444 106,883
Additional paid-in capital . . . ....................................... 5,090,891 4,684,112
Accumulated other comprehensive loss (net of tax benefit of $23,448 and $43,202,
respectively) . ................................................. (40,825) (76,476)
Retained earnings ................................................ 604,467 426,175
Total SLM Corporation stockholders’ equity before treasury stock . ............ 7,140,347 6,855,464
Common stock held in treasury at cost: 67,222 and 66,958 shares, respectively . . . . 1,861,738 1,856,394
Total SLM Corporation stockholders’ equity . ............................ 5,278,609 4,999,070
Noncontrolling interest ............................................ 13 7,270
Total equity . . . ................................................. 5,278,622 5,006,340
Total liabilities and stockholders’ equity ................................ $169,985,298 $168,768,437
See accompanying notes to consolidated financial statements.
F-4