Sallie Mae 2009 Annual Report Download - page 49
Download and view the complete annual report
Please find page 49 of the 2009 Sallie Mae annual report below. You can navigate through the pages in the report by either clicking on the pages listed below, or by using the keyword search tool below to find specific information within the annual report.-
 1
1 -
2
-
3
-
4
-
5
-
6
-
7
-
8
-
9
-
10
-
11
-
12
-
13
-
14
-
15
-
16
-
17
-
18
-
19
-
20
-
21
-
22
-
23
-
24
-
25
-
26
-
27
-
28
-
29
-
30
-
31
-
32
-
33
-
34
-
35
-
36
-
37
-
38
-
 39
39 -
 40
40 -
 41
41 -
 42
42 -
 43
43 -
 44
44 -
 45
45 -
 46
46 -
 47
47 -
 48
48 -
 49
49 -
 50
50 -
 51
51 -
 52
52 -
 53
53 -
 54
54 -
 55
55 -
 56
56 -
 57
57 -
 58
58 -
 59
59 -
60
-
61
-
62
-
63
-
64
-
65
-
66
-
67
-
68
-
69
-
70
-
71
-
72
-
73
-
74
-
75
-
76
-
77
-
78
-
79
-
80
-
81
-
82
-
83
-
84
-
85
-
86
-
87
-
88
-
89
-
90
-
91
-
92
-
93
-
94
-
95
-
96
-
97
-
98
-
99
-
100
-
101
-
102
-
103
-
104
-
105
-
106
-
107
-
108
-
109
-
110
-
111
-
112
-
113
-
114
-
115
-
116
-
117
-
118
-
119
-
120
-
121
-
122
-
123
-
124
-
125
-
126
-
127
-
128
-
129
-
130
-
131
-
132
-
133
-
134
-
135
-
136
-
137
-
138
-
139
-
140
-
141
-
142
-
143
-
144
-
145
-
146
-
147
-
148
-
149
-
150
-
151
-
152
-
153
-
154
-
155
-
156
-
157
-
158
-
159
-
160
-
161
-
162
-
163
-
164
-
165
-
166
-
167
-
168
-
169
-
170
-
171
-
172
-
173
-
174
-
175
-
176
-
177
-
178
-
179
-
180
-
181
-
182
-
183
-
184
-
185
-
186
-
187
-
188
-
189
-
190
-
191
-
192
-
193
-
194
-
195
-
196
-
197
-
198
-
199
-
200
-
201
-
202
-
203
-
204
-
205
-
206
-
207
-
208
-
209
-
210
-
211
-
212
-
213
-
214
-
215
-
216
-
217
-
218
-
219
-
220
-
221
-
222
-
223
-
224
-
225
-
226
-
227
-
228
-
229
-
230
-
231
-
232
-
233
-
234
-
235
-
236
-
237
-
238
-
239
-
240
-
241
-
242
-
243
-
244
-
245
-
246
-
247
-
248
-
249
-
250
-
251
-
252
-
253
-
254
-
255
-
256
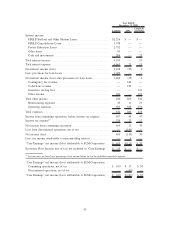
 |
 |

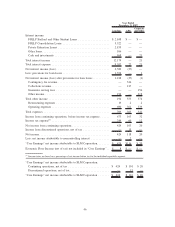
Lending APG
Corporate
and Other Lending APG
Corporate
and Other Lending APG
Corporate
and Other
2009 2008 2007
Years Ended December 31,
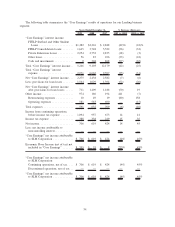
“Core Earnings” adjustments:
Net impact of securitization
accounting.................... $(201) $— $ — $ (442) $ — $ — $ 247 $ — $ —
Net impact of derivative accounting . . . (306) — — (560) — — 217 — (1,558)
Net impact of Floor Income......... 129 — — (102) — — (169) — —
Net impact of acquired intangibles .... (13) (6) (57) (53) (22) (14) (55) (22) (29)
Total “Core Earnings” adjustments to
GAAP, pre-tax
(1)
............... $(391) $ (6) $(57) $(1,157) $(22) $(14) $ 240 $(22) $(1,587)
(1)
The net tax effect of total differences for combined segments is $181 million, $454 million and $(87) million for the years ended
December 31, 2009, 2008 and 2007, respectively. Income taxes are based on a percentage of net income before tax for the indi-
vidual reportable segments.
1) Securitization Accounting: Under GAAP, certain securitization transactions in our Lending operat-
ing segment are accounted for as sales of assets. Under “Core Earnings” for the Lending operating segment,
we present all securitization transactions on a “Core Earnings” basis as long-term non-recourse financings.
The upfront “gains” on sale from securitization transactions, as well as ongoing “servicing and securitization
revenue” presented in accordance with GAAP, are excluded from “Core Earnings” and are replaced by interest
income, provisions for loan losses, and interest expense as earned or incurred on the securitization loans and
debt. We also exclude transactions with our off-balance sheet trusts from “Core Earnings” as they are
considered intercompany transactions on a “Core Earnings” basis.
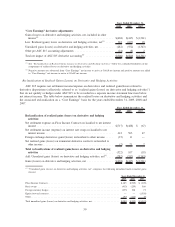
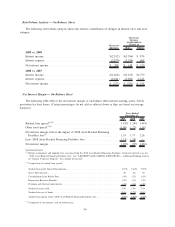
The following table summarizes “Core Earnings” securitization adjustments for the Lending operating
segment for the years ended December 31, 2009, 2008 and 2007.
2009 2008 2007
Years Ended December 31,
“Core Earnings” securitization adjustments:
Net interest income on securitized loans, before provisions for loan losses
and before intercompany transactions .......................... $(942) $(872) $(818)
Provisions for loan losses..................................... 445 309 380
Net interest income on securitized loans, after provisions for loan losses,
before intercompany transactions ............................. (497) (563) (438)
Intercompany transactions with off-balance sheet trusts ............... 1 (141) (119)
Net interest income on securitized loans, after provisions for loan losses . . (496) (704) (557)
Gains on student loan securitizations ............................ — — 367
Servicing and securitization revenue ............................. 295 262 437
Total “Core Earnings” securitization adjustments
(1)
.................. $(201) $(442) $ 247
(1)
Negative amounts are subtracted from “Core Earnings” net income to arrive at GAAP net income and positive amounts are added
to “Core Earnings” net income to arrive at GAAP net income.
“Intercompany transactions with off-balance sheet trusts” in the above table relate primarily to losses that
result from the repurchase of delinquent loans from our off-balance sheet securitization trusts. When Private
Education Loans in our securitization trusts settling before September 30, 2005 became 180 days delinquent,
we previously exercised our contingent call option to repurchase these loans at par value out of the trust and
recorded a loss for the difference in the par value paid and the fair market value of the loan at the time of
purchase. We do not hold the contingent call option for any trusts settled after September 30, 2005. In October
2008, the Company decided to no longer exercise its contingent call option.
48