Sallie Mae 2009 Annual Report Download - page 222
Download and view the complete annual report
Please find page 222 of the 2009 Sallie Mae annual report below. You can navigate through the pages in the report by either clicking on the pages listed below, or by using the keyword search tool below to find specific information within the annual report.-
 1
1 -
2
-
3
-
4
-
5
-
6
-
7
-
8
-
9
-
10
-
11
-
12
-
13
-
14
-
15
-
16
-
17
-
18
-
19
-
20
-
21
-
22
-
23
-
24
-
25
-
26
-
27
-
28
-
29
-
30
-
31
-
32
-
33
-
34
-
35
-
36
-
37
-
38
-
39
-
40
-
41
-
42
-
43
-
44
-
45
-
46
-
47
-
48
-
49
-
50
-
51
-
52
-
53
-
54
-
55
-
56
-
57
-
58
-
59
-
60
-
61
-
62
-
63
-
64
-
65
-
66
-
67
-
68
-
69
-
70
-
71
-
72
-
73
-
74
-
75
-
76
-
77
-
78
-
79
-
80
-
81
-
82
-
83
-
84
-
85
-
86
-
87
-
88
-
89
-
90
-
91
-
92
-
93
-
94
-
95
-
96
-
97
-
98
-
99
-
100
-
101
-
102
-
103
-
104
-
105
-
106
-
107
-
108
-
109
-
110
-
111
-
112
-
113
-
114
-
115
-
116
-
117
-
118
-
119
-
120
-
121
-
122
-
123
-
124
-
125
-
126
-
127
-
128
-
129
-
130
-
131
-
132
-
133
-
134
-
135
-
136
-
137
-
138
-
139
-
140
-
141
-
142
-
143
-
144
-
145
-
146
-
147
-
148
-
149
-
150
-
151
-
152
-
153
-
154
-
155
-
156
-
157
-
158
-
159
-
160
-
161
-
162
-
163
-
164
-
165
-
166
-
167
-
168
-
169
-
170
-
171
-
172
-
173
-
174
-
175
-
176
-
177
-
178
-
179
-
180
-
181
-
182
-
183
-
184
-
185
-
186
-
187
-
188
-
189
-
190
-
191
-
192
-
193
-
194
-
195
-
196
-
197
-
198
-
199
-
200
-
201
-
202
-
203
-
204
-
205
-
206
-
207
-
208
-
209
-
210
-
211
-
 212
212 -
 213
213 -
 214
214 -
 215
215 -
 216
216 -
 217
217 -
 218
218 -
 219
219 -
 220
220 -
 221
221 -
 222
222 -
 223
223 -
 224
224 -
 225
225 -
 226
226 -
 227
227 -
 228
228 -
 229
229 -
 230
230 -
 231
231 -
 232
232 -
233
-
234
-
235
-
236
-
237
-
238
-
239
-
240
-
241
-
242
-
243
-
244
-
245
-
246
-
247
-
248
-
249
-
250
-
251
-
252
-
253
-
254
-
255
-
256
 |
 |

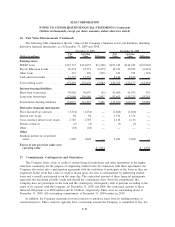
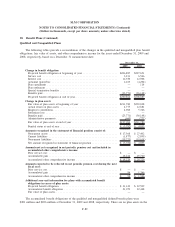
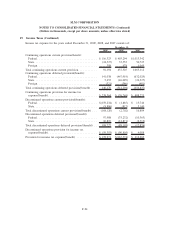
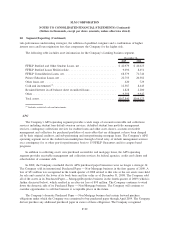
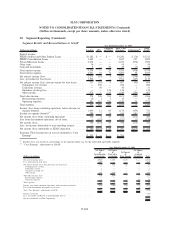
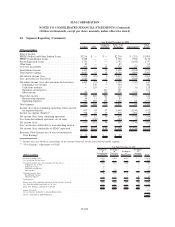
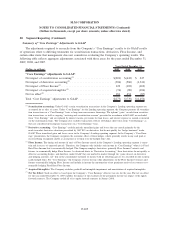
19. Income Taxes (Continued)
At December 31, 2009 and 2008, the tax effect of temporary differences that give rise to deferred tax
assets and liabilities include the following:
2009 2008
December 31,
Deferred tax assets:
Loan reserves .......................................... $ 737,762 $1,212,653
Market value adjustments on student loans, investments and
derivatives ........................................... 496,101 174,276
Deferred revenue ........................................ 83,042 70,172
Stock-based compensation plans ............................. 70,528 62,325
Accrued expenses not currently deductible ..................... 47,249 38,330
Purchased paper impairments ............................... 42,892 111,924
Operating loss and credit carryovers .......................... 36,747 28,293
Unrealized investment losses ............................... 25,949 42,838
Warrants issuance ....................................... 19,716 27,160
Other................................................. 32,717 87,954
Total deferred tax assets ................................... 1,592,703 1,855,925
Deferred tax liabilities:
Gains/(losses) on repurchased debt ........................... 187,505 —
Securitization transactions . . ............................... 93,254 302,049
Leases ................................................ 64,246 73,570
Other................................................. 37,170 12,883
Total deferred tax liabilities . ............................... 382,175 388,502
Net deferred tax assets .................................... $1,210,528 $1,467,423
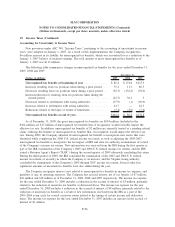
Included in other deferred tax assets is a valuation allowance of $25,111 and $4,901 as of December 31,
2009 and 2008, respectively, against a portion of the Company’s federal, state and international deferred tax
assets. The valuation allowance is primarily attributable to deferred tax assets for federal and state capital loss
carryovers and state net operating loss carryovers that management believes it is more likely than not will
expire prior to being realized. The change in the valuation allowance primarily resulted from the sale of the
assets in its Purchased Paper-Mortgage/Properties business. The ultimate realization of the deferred tax assets
is dependent upon the generation of future taxable income of the appropriate character (i.e. capital or ordinary)
during the period in which the temporary differences become deductible. Management considers, among other
things, the economic slowdown, any impacts if SAFRA or the Community Proposal are passed, the scheduled
reversals of deferred tax liabilities, and the history of positive taxable income available for net operating loss
carrybacks in evaluating the realizability of the deferred tax assets.
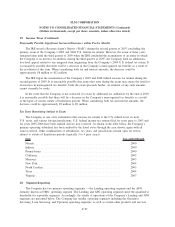
As of December 31, 2009, the Company has federal net operating loss carryforwards of $21,020 which
begin to expire in 2022, apportioned state net operating loss carryforwards of $89,958 which begin to expire
in 2010, federal and state capital loss carryovers of $44,289 which begin to expire in 2012, and federal and
state credit carryovers of $1,845 which begin to expire in 2021.
F-95
SLM CORPORATION
NOTES TO CONSOLIDATED FINANCIAL STATEMENTS (Continued)
(Dollars in thousands, except per share amounts, unless otherwise stated)