Sallie Mae 2009 Annual Report Download - page 229
Download and view the complete annual report
Please find page 229 of the 2009 Sallie Mae annual report below. You can navigate through the pages in the report by either clicking on the pages listed below, or by using the keyword search tool below to find specific information within the annual report.-
 1
1 -
2
-
3
-
4
-
5
-
6
-
7
-
8
-
9
-
10
-
11
-
12
-
13
-
14
-
15
-
16
-
17
-
18
-
19
-
20
-
21
-
22
-
23
-
24
-
25
-
26
-
27
-
28
-
29
-
30
-
31
-
32
-
33
-
34
-
35
-
36
-
37
-
38
-
39
-
40
-
41
-
42
-
43
-
44
-
45
-
46
-
47
-
48
-
49
-
50
-
51
-
52
-
53
-
54
-
55
-
56
-
57
-
58
-
59
-
60
-
61
-
62
-
63
-
64
-
65
-
66
-
67
-
68
-
69
-
70
-
71
-
72
-
73
-
74
-
75
-
76
-
77
-
78
-
79
-
80
-
81
-
82
-
83
-
84
-
85
-
86
-
87
-
88
-
89
-
90
-
91
-
92
-
93
-
94
-
95
-
96
-
97
-
98
-
99
-
100
-
101
-
102
-
103
-
104
-
105
-
106
-
107
-
108
-
109
-
110
-
111
-
112
-
113
-
114
-
115
-
116
-
117
-
118
-
119
-
120
-
121
-
122
-
123
-
124
-
125
-
126
-
127
-
128
-
129
-
130
-
131
-
132
-
133
-
134
-
135
-
136
-
137
-
138
-
139
-
140
-
141
-
142
-
143
-
144
-
145
-
146
-
147
-
148
-
149
-
150
-
151
-
152
-
153
-
154
-
155
-
156
-
157
-
158
-
159
-
160
-
161
-
162
-
163
-
164
-
165
-
166
-
167
-
168
-
169
-
170
-
171
-
172
-
173
-
174
-
175
-
176
-
177
-
178
-
179
-
180
-
181
-
182
-
183
-
184
-
185
-
186
-
187
-
188
-
189
-
190
-
191
-
192
-
193
-
194
-
195
-
196
-
197
-
198
-
199
-
200
-
201
-
202
-
203
-
204
-
205
-
206
-
207
-
208
-
209
-
210
-
211
-
212
-
213
-
214
-
215
-
216
-
217
-
218
-
 219
219 -
 220
220 -
 221
221 -
 222
222 -
 223
223 -
 224
224 -
 225
225 -
 226
226 -
 227
227 -
 228
228 -
 229
229 -
 230
230 -
 231
231 -
 232
232 -
 233
233 -
 234
234 -
 235
235 -
 236
236 -
 237
237 -
 238
238 -
 239
239 -
240
-
241
-
242
-
243
-
244
-
245
-
246
-
247
-
248
-
249
-
250
-
251
-
252
-
253
-
254
-
255
-
256
 |
 |

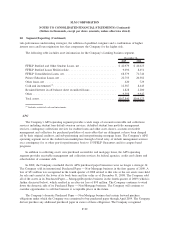
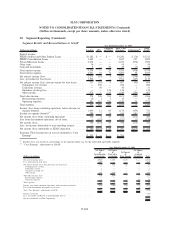
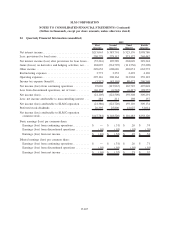
20. Segment Reporting (Continued)
Segment Results and Reconciliations to GAAP
(Dollars in millions) Lending APG Corporate
and Other Total “Core
Earnings” Adjustments
(2)
Total
GAAP
Year Ended December 31, 2009
Interest income:
FFELP Stafford and Other Student Loans . . . . . . . . . . . . . . . . $1,282 $ — $ — $1,282 $ (70) $1,212
FFELP Consolidation Loans. . . . . . . . . . . . . . . . . . . . . . . . . 1,645 — — 1,645 237 1,882
Private Education Loans . . . . . . . . . . . . . . . . . . . . . . . . . . . 2,254 — — 2,254 (672) 1,582
Other loans . . . . . . . . . . . . . . . . . . . . . . . . . . . . . . . . . . . . 56 — — 56 — 56
Cash and investments . . . . . . . . . . . . . . . . . . . . . . . . . . . . . 9 — 20 29 (3) 26
Total interest income. . . . . . . . . . . . . . . . . . . . . . . . . . . . . . 5,246 — 20 5,266 (508) 4,758
Total interest expense . . . . . . . . . . . . . . . . . . . . . . . . . . . . . 2,971 19 15 3,005 30 3,035
Net interest income (loss) . . . . . . . . . . . . . . . . . . . . . . . . . . 2,275 (19) 5 2,261 (538) 1,723
Less: provisions for loan losses. . . . . . . . . . . . . . . . . . . . . . . 1,564 — — 1,564 (445) 1,119
Net interest income (loss) after provisions for loan losses . . . . . 711 (19) 5 697 (93) 604
Contingency fee revenue . . . . . . . . . . . . . . . . . . . . . . . . . — 296 — 296 — 296
Collections revenue . . . . . . . . . . . . . . . . . . . . . . . . . . . . . — 50 — 50 1 51
Guarantor servicing fees. . . . . . . . . . . . . . . . . . . . . . . . . . — — 136 136 — 136
Other income . . . . . . . . . . . . . . . . . . . . . . . . . . . . . . . . . 974 — 215 1,189 (286) 903
Total other income . . . . . . . . . . . . . . . . . . . . . . . . . . . . . . . 974 346 351 1,671 (285) 1,386
Restructuring expenses. . . . . . . . . . . . . . . . . . . . . . . . . . . 10 1 3 14 — 14
Operating expenses . . . . . . . . . . . . . . . . . . . . . . . . . . . . . 581 315 284 1,180 75 1,255
Total expenses . . . . . . . . . . . . . . . . . . . . . . . . . . . . . . . . . . 591 316 287 1,194 75 1,269
Income (loss) from continuing operations, before income tax
expense (benefit). . . . . . . . . . . . . . . . . . . . . . . . . . . . . . . 1,094 11 69 1,174 (453) 721
Income tax expense (benefit)
(1)
. . . . . . . . . . . . . . . . . . . . . . . 388 7 24 419 (181) 238
Net income (loss) from continuing operations . . . . . . . . . . . . . 706 4 45 755 (272) 483
Loss from discontinued operations, net of taxes . . . . . . . . . . . . — (157) — (157) (1) (158)
Net income (loss) . . . . . . . . . . . . . . . . . . . . . . . . . . . . . . . . 706 (153) 45 598 (273) 325
Less: net income attributable to noncontrolling interest . . . . . . . — 1 — 1 — 1
Net income (loss) attributable to SLM Corporation . . . . . . . . . $ 706 $(154) $ 45 $ 597 $(273) $ 324
Economic Floor Income (net of tax) not included in “Core
Earnings” . . . . . . . . . . . . . . . . . . . . . . . . . . . . . . . . . . . $ 205 $ — $ — $ 205
(1)
Income taxes are based on a percentage of net income before tax for the individual reportable segment.
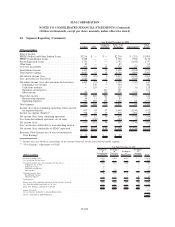
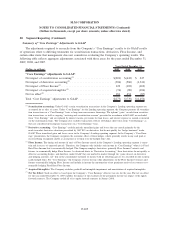
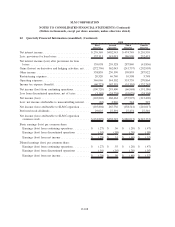
(2)
“Core Earnings” adjustments to GAAP:
(Dollars in millions)
Net Impact
of
Securitization
Accounting
Net Impact
of
Derivative
Accounting
Net Impact
of
Floor Income
Net Impact
of
Acquired
Intangibles Total
Year Ended December 31, 2009
Net interest income (loss) . . . . . . . . . . . . . . . . . . . . . . . . . . . . . . . . . . . . . $(965) $ 298 $129 $ — $(538)
Less: provisions for loan losses . . . . . . . . . . . . . . . . . . . . . . . . . . . . . . . . . . (445) — — — (445)
Net interest income (loss) after provisions for loan losses . . . . . . . . . . . . . . . . . . . (520) 298 129 — (93)
Contingency fee revenue. . . . . . . . . . . . . . . . . . . . . . . . . . . . . . . . . . . . . — — — — —
Collections revenue. . . . . . . . . . . . . . . . . . . . . . . . . . . . . . . . . . . . . . . . 1 — — — 1
Guarantor servicing fees . . . . . . . . . . . . . . . . . . . . . . . . . . . . . . . . . . . . . — — — — —
Other income . . . . . . . . . . . . . . . . . . . . . . . . . . . . . . . . . . . . . . . . . . . 318 (604) — — (286)
Total other income (loss) . . . . . . . . . . . . . . . . . . . . . . . . . . . . . . . . . . . . . . 319 (604) — — (285)
Restructuring expenses . . . . . . . . . . . . . . . . . . . . . . . . . . . . . . . . . . . . . . — — — — —
Operating expenses . . . . . . . . . . . . . . . . . . . . . . . . . . . . . . . . . . . . . . . . — — — 75 75
Total expenses . . . . . . . . . . . . . . . . . . . . . . . . . . . . . . . . . . . . . . . . . . . . — — — 75 75
Income (loss) from continuing operations, before income tax benefit . . . . . . . . . . . . . (201) (306) 129 (75) (453)
Loss from discontinued operations, net of taxes . . . . . . . . . . . . . . . . . . . . . . . . . — — — (1) (1)
Total “Core Earnings” adjustments to GAAP . . . . . . . . . . . . . . . . . . . . . . . . . . $(201) $(306) $129 $(76) (454)
Income tax benefit . . . . . . . . . . . . . . . . . . . . . . . . . . . . . . . . . . . . . . . . . (181)
Less: net income attributable to noncontrolling interest . . . . . . . . . . . . . . . . . . . . . —
Net loss attributable to SLM Corporation . . . . . . . . . . . . . . . . . . . . . . . . . . . . . $(273)
F-102
SLM CORPORATION
NOTES TO CONSOLIDATED FINANCIAL STATEMENTS (Continued)
(Dollars in thousands, except per share amounts, unless otherwise stated)