Sallie Mae 2009 Annual Report Download - page 52
Download and view the complete annual report
Please find page 52 of the 2009 Sallie Mae annual report below. You can navigate through the pages in the report by either clicking on the pages listed below, or by using the keyword search tool below to find specific information within the annual report.-
 1
1 -
2
-
3
-
4
-
5
-
6
-
7
-
8
-
9
-
10
-
11
-
12
-
13
-
14
-
15
-
16
-
17
-
18
-
19
-
20
-
21
-
22
-
23
-
24
-
25
-
26
-
27
-
28
-
29
-
30
-
31
-
32
-
33
-
34
-
35
-
36
-
37
-
38
-
39
-
40
-
41
-
 42
42 -
 43
43 -
 44
44 -
 45
45 -
 46
46 -
 47
47 -
 48
48 -
 49
49 -
 50
50 -
 51
51 -
 52
52 -
 53
53 -
 54
54 -
 55
55 -
 56
56 -
 57
57 -
 58
58 -
 59
59 -
 60
60 -
 61
61 -
 62
62 -
63
-
64
-
65
-
66
-
67
-
68
-
69
-
70
-
71
-
72
-
73
-
74
-
75
-
76
-
77
-
78
-
79
-
80
-
81
-
82
-
83
-
84
-
85
-
86
-
87
-
88
-
89
-
90
-
91
-
92
-
93
-
94
-
95
-
96
-
97
-
98
-
99
-
100
-
101
-
102
-
103
-
104
-
105
-
106
-
107
-
108
-
109
-
110
-
111
-
112
-
113
-
114
-
115
-
116
-
117
-
118
-
119
-
120
-
121
-
122
-
123
-
124
-
125
-
126
-
127
-
128
-
129
-
130
-
131
-
132
-
133
-
134
-
135
-
136
-
137
-
138
-
139
-
140
-
141
-
142
-
143
-
144
-
145
-
146
-
147
-
148
-
149
-
150
-
151
-
152
-
153
-
154
-
155
-
156
-
157
-
158
-
159
-
160
-
161
-
162
-
163
-
164
-
165
-
166
-
167
-
168
-
169
-
170
-
171
-
172
-
173
-
174
-
175
-
176
-
177
-
178
-
179
-
180
-
181
-
182
-
183
-
184
-
185
-
186
-
187
-
188
-
189
-
190
-
191
-
192
-
193
-
194
-
195
-
196
-
197
-
198
-
199
-
200
-
201
-
202
-
203
-
204
-
205
-
206
-
207
-
208
-
209
-
210
-
211
-
212
-
213
-
214
-
215
-
216
-
217
-
218
-
219
-
220
-
221
-
222
-
223
-
224
-
225
-
226
-
227
-
228
-
229
-
230
-
231
-
232
-
233
-
234
-
235
-
236
-
237
-
238
-
239
-
240
-
241
-
242
-
243
-
244
-
245
-
246
-
247
-
248
-
249
-
250
-
251
-
252
-
253
-
254
-
255
-
256
 |
 |

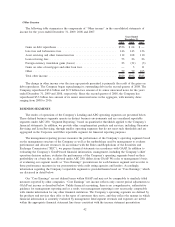
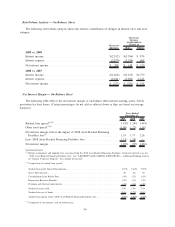
Unrealized gains and losses on Floor Income Contracts are primarily caused by changes in interest rates
and the forward interest rate curve. In general, an increase in interest rates, or a steepening of the forward
interest rate curve, results in an unrealized gain and vice versa. Unrealized gains and losses on basis swaps
result from changes in the spread between indices and on changes in the forward interest rate curves that
impact basis swaps hedging repricing risk between quarterly reset debt and daily reset assets. Unrealized gains
(losses) on foreign currency hedges are primarily the result of ineffectiveness on cross-currency interest rate
swaps hedging foreign currency denominated debt related to differences between forward and spot foreign
currency exchange rates.
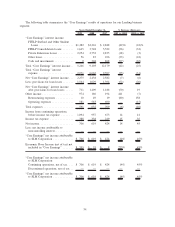
3) Floor Income: The timing and amount (if any) of Floor Income earned in our Lending operating
segment is uncertain and in excess of expected spreads. Therefore, we only include such income in “Core
Earnings” when it is Fixed Rate Floor Income that is economically hedged. We employ derivatives, primarily
Floor Income Contracts, to economically hedge Floor Income. As discussed above in “Derivative Accounting,”
these derivatives do not qualify as effective accounting hedges and, therefore, under GAAP, they are
marked-to-market through the “gains (losses) on derivative and hedging activities, net” line in the consolidated
statement of income with no offsetting gain or loss recorded for the economically hedged items. For “Core
Earnings,” we reverse the fair value adjustments on the Floor Income Contracts economically hedging Floor
Income and include in income the amortization of net premiums received on contracts economically hedging
Fixed Rate Floor Income.
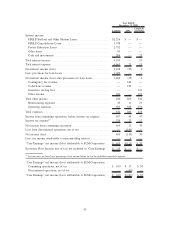
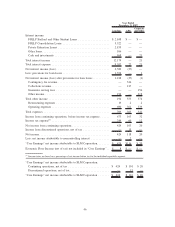
The following table summarizes the Floor Income adjustments in our Lending operating segment for the
years ended December 31, 2009, 2008 and 2007.
2009 2008 2007
Years Ended December 31,
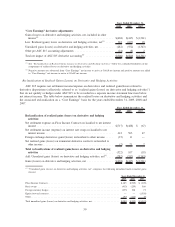
“Core earnings” Floor Income adjustments:
Floor Income earned on Managed loans, net of payments on Floor Income
Contracts . . . ............................................ $286 $ 69 $ —
Amortization of net premiums on Floor Income Contracts and futures in
net interest income ........................................ (157) (171) (169)
Total “Core Earnings” Floor Income adjustments
(1)
.................. $129 $(102) $(169)
(1)
Negative amounts are subtracted from “Core Earnings” net income to arrive at GAAP net income and positive amounts are added
to “Core Earnings” net income to arrive at GAAP net income.
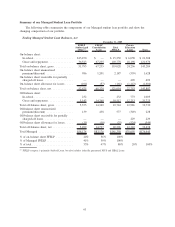
(2)
The following table summarizes the amount of Economic Floor Income earned during the years ended December 31, 2009, 2008
and 2007 that is not included in “Core Earnings” net income:
2009 2008 2007
Years Ended December 31,
Floor Income earned on Managed loans, net of payments on Floor Income Contracts, not
included in “Core Earnings” ......................................... $286 $ 69 $ —
Amortization of net premiums on Variable Rate Floor Income Contracts not included in
“Core Earnings” . . ............................................... 40 20 13
Amortization of net premiums on Fixed Rate Floor Income Contracts included in “Core
Earnings” . .................................................... 157 171 169
Total Economic Floor Income earned ..................................... 483 260 182
Less: Amortization of net premiums on Fixed Rate Floor Income Contracts included in
“Core Earnings” . . ............................................... (157) (171) (169)
Total Economic Floor Income earned, not included in “Core Earnings” . . . ............ $326 $ 89 $ 13
51