Sallie Mae 2009 Annual Report Download - page 28
Download and view the complete annual report
Please find page 28 of the 2009 Sallie Mae annual report below. You can navigate through the pages in the report by either clicking on the pages listed below, or by using the keyword search tool below to find specific information within the annual report.-
 1
1 -
2
-
3
-
4
-
5
-
6
-
7
-
8
-
9
-
10
-
11
-
12
-
13
-
14
-
15
-
16
-
17
-
 18
18 -
 19
19 -
 20
20 -
 21
21 -
 22
22 -
 23
23 -
 24
24 -
 25
25 -
 26
26 -
 27
27 -
 28
28 -
 29
29 -
 30
30 -
 31
31 -
 32
32 -
 33
33 -
 34
34 -
 35
35 -
 36
36 -
 37
37 -
 38
38 -
39
-
40
-
41
-
42
-
43
-
44
-
45
-
46
-
47
-
48
-
49
-
50
-
51
-
52
-
53
-
54
-
55
-
56
-
57
-
58
-
59
-
60
-
61
-
62
-
63
-
64
-
65
-
66
-
67
-
68
-
69
-
70
-
71
-
72
-
73
-
74
-
75
-
76
-
77
-
78
-
79
-
80
-
81
-
82
-
83
-
84
-
85
-
86
-
87
-
88
-
89
-
90
-
91
-
92
-
93
-
94
-
95
-
96
-
97
-
98
-
99
-
100
-
101
-
102
-
103
-
104
-
105
-
106
-
107
-
108
-
109
-
110
-
111
-
112
-
113
-
114
-
115
-
116
-
117
-
118
-
119
-
120
-
121
-
122
-
123
-
124
-
125
-
126
-
127
-
128
-
129
-
130
-
131
-
132
-
133
-
134
-
135
-
136
-
137
-
138
-
139
-
140
-
141
-
142
-
143
-
144
-
145
-
146
-
147
-
148
-
149
-
150
-
151
-
152
-
153
-
154
-
155
-
156
-
157
-
158
-
159
-
160
-
161
-
162
-
163
-
164
-
165
-
166
-
167
-
168
-
169
-
170
-
171
-
172
-
173
-
174
-
175
-
176
-
177
-
178
-
179
-
180
-
181
-
182
-
183
-
184
-
185
-
186
-
187
-
188
-
189
-
190
-
191
-
192
-
193
-
194
-
195
-
196
-
197
-
198
-
199
-
200
-
201
-
202
-
203
-
204
-
205
-
206
-
207
-
208
-
209
-
210
-
211
-
212
-
213
-
214
-
215
-
216
-
217
-
218
-
219
-
220
-
221
-
222
-
223
-
224
-
225
-
226
-
227
-
228
-
229
-
230
-
231
-
232
-
233
-
234
-
235
-
236
-
237
-
238
-
239
-
240
-
241
-
242
-
243
-
244
-
245
-
246
-
247
-
248
-
249
-
250
-
251
-
252
-
253
-
254
-
255
-
256
 |
 |
rate projections to each category of loans. Once the quantitative calculation is performed, management reviews the
adequacy of the allowance for loan losses and determines if qualitative adjustments need to be considered. One
technique for making this determination is through projection modeling, which is used to determine if the
allowance for loan losses is sufficient to absorb credit losses anticipated during the loss confirmation period.
Projection modeling is a forward-looking projection of charge-offs. Assumptions that are utilized in the projection
modeling include (but are not limited to) historical experience, recent changes in collection policies and procedures,
collection performance, and macroeconomic indicators. Additionally, management considers changes in laws and
regulations that could potentially impact the allowance for loan losses.
The current and future economic environment is taken into account by the Company when calculating the
allowance for loan loss. The Company analyzes key economic statistics and the impact they will have on
future charge-offs. Key economic statistics analyzed as part of the allowance for loan loss are unemployment
rates (total and specific to college graduates), consumer confidence and other asset type delinquency rates
(credit cards, mortgages). As a result of the economy, provision expense has remained elevated since the
fourth quarter of 2008. If the economy weakens beyond our expectations, the expected losses resulting from
our default and collection estimates embedded in the allowance could be higher than currently projected.
As part of concluding on the adequacy of the allowance for loan loss, the Company also reviews key
allowance and loan metrics. The most relevant of these metrics considered are the allowance coverage of
charge-offs ratio; the allowance as a percentage of total loans and of loans in repayment; and delinquency and
forbearance percentages.
In 2009, the Company implemented a program which offers loan modifications to borrowers who qualify.
Temporary interest rate concessions are granted to borrowers experiencing financial difficulties and who meet
other criteria. The allowance on these loans is calculated based on the present value of the expected cash flows
(including estimates of future defaults) discounted at the loan’s effective interest rate. This calculation contains
estimates which are inherently subjective and are evaluated on a periodic basis.
Historically, our Private Education Loan programs do not require that borrowers begin repayment until six
months after they have graduated or otherwise left school. Consequently, our loss estimates for these programs
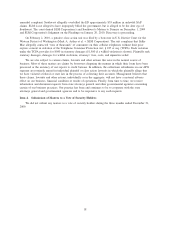
are generally low while the borrower is in school. At December 31, 2009, 31 percent of the principal balance
in the higher education Managed Private Education Loan portfolio is related to borrowers who are in in-school
or grace status and not required to make payments. As the current portfolio ages, an increasing percentage of
the borrowers will leave school and be required to begin payments on their loans. The allowance for losses
will change accordingly.
Similar to the rules governing FFELP payment requirements, our collection policies allow for periods of
nonpayment for borrowers requesting additional payment grace periods upon leaving school or experiencing
temporary difficulty meeting payment obligations. This is referred to as forbearance status and is considered
separately in our allowance for loan losses. The loss confirmation period is in alignment with our typical
collection cycle and takes into account these periods of forbearance.
In general, Private Education Loan principal is charged-off against the allowance when the loan exceeds
212 days delinquency. The charge-off amount equals the estimated loss of the defaulted loan balance. Actual
recoveries, as they are received, are applied against the remaining loan balance that was not charged off. If
periodic recoveries are less than originally expected, the difference results in immediate additional provision
expense and charge off of such amount.
FFELP loans are guaranteed as to their principal and accrued interest in the event of default subject to a
Risk Sharing level set based on the date of loan disbursement. For loans disbursed after October 1, 1993, and
before July 1, 2006, we receive 98 percent reimbursement on all qualifying default claims. For loans disbursed
on or after July 1, 2006, we receive 97 percent reimbursement. The CCRAA reduces the Risk Sharing level
for loans disbursed on or after October 1, 2012 to 95 percent reimbursement.
Similar to the allowance for Private Education Loan losses, the allowance for FFELP loan losses uses
historical experience of borrower default behavior and a two-year loss confirmation period to estimate the
credit losses incurred in the loan portfolio at the reporting date. We divide the portfolio into categories of
27