Sallie Mae 2009 Annual Report Download - page 132
Download and view the complete annual report
Please find page 132 of the 2009 Sallie Mae annual report below. You can navigate through the pages in the report by either clicking on the pages listed below, or by using the keyword search tool below to find specific information within the annual report.-
 1
1 -
2
-
3
-
4
-
5
-
6
-
7
-
8
-
9
-
10
-
11
-
12
-
13
-
14
-
15
-
16
-
17
-
18
-
19
-
20
-
21
-
22
-
23
-
24
-
25
-
26
-
27
-
28
-
29
-
30
-
31
-
32
-
33
-
34
-
35
-
36
-
37
-
38
-
39
-
40
-
41
-
42
-
43
-
44
-
45
-
46
-
47
-
48
-
49
-
50
-
51
-
52
-
53
-
54
-
55
-
56
-
57
-
58
-
59
-
60
-
61
-
62
-
63
-
64
-
65
-
66
-
67
-
68
-
69
-
70
-
71
-
72
-
73
-
74
-
75
-
76
-
77
-
78
-
79
-
80
-
81
-
82
-
83
-
84
-
85
-
86
-
87
-
88
-
89
-
90
-
91
-
92
-
93
-
94
-
95
-
96
-
97
-
98
-
99
-
100
-
101
-
102
-
103
-
104
-
105
-
106
-
107
-
108
-
109
-
110
-
111
-
112
-
113
-
114
-
115
-
116
-
117
-
118
-
119
-
120
-
121
-
 122
122 -
 123
123 -
 124
124 -
 125
125 -
 126
126 -
 127
127 -
 128
128 -
 129
129 -
 130
130 -
 131
131 -
 132
132 -
 133
133 -
 134
134 -
 135
135 -
 136
136 -
 137
137 -
 138
138 -
 139
139 -
 140
140 -
 141
141 -
 142
142 -
143
-
144
-
145
-
146
-
147
-
148
-
149
-
150
-
151
-
152
-
153
-
154
-
155
-
156
-
157
-
158
-
159
-
160
-
161
-
162
-
163
-
164
-
165
-
166
-
167
-
168
-
169
-
170
-
171
-
172
-
173
-
174
-
175
-
176
-
177
-
178
-
179
-
180
-
181
-
182
-
183
-
184
-
185
-
186
-
187
-
188
-
189
-
190
-
191
-
192
-
193
-
194
-
195
-
196
-
197
-
198
-
199
-
200
-
201
-
202
-
203
-
204
-
205
-
206
-
207
-
208
-
209
-
210
-
211
-
212
-
213
-
214
-
215
-
216
-
217
-
218
-
219
-
220
-
221
-
222
-
223
-
224
-
225
-
226
-
227
-
228
-
229
-
230
-
231
-
232
-
233
-
234
-
235
-
236
-
237
-
238
-
239
-
240
-
241
-
242
-
243
-
244
-
245
-
246
-
247
-
248
-
249
-
250
-
251
-
252
-
253
-
254
-
255
-
256
 |
 |

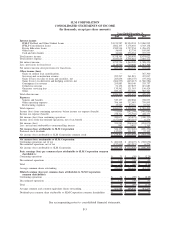
SLM CORPORATION
CONSOLIDATED STATEMENTS OF INCOME
(In thousands, except per share amounts)
2009 2008 2007
Years Ended December 31,
Interest income:
FFELP Stafford and Other Student Loans .............................. $1,211,587 $1,994,394 $ 2,060,993
FFELP Consolidation Loans . . . .................................... 1,882,195 3,178,692 4,343,138
Private Education Loans .......................................... 1,582,514 1,737,554 1,456,471
Other loans . . . . . .............................................. 56,005 82,734 105,843
Cash and investments . . .......................................... 26,064 276,264 707,577
Total interest income .............................................. 4,758,365 7,269,638 8,674,022
Total interest expense.............................................. 3,035,639 5,905,418 7,085,772
Net interest income . .............................................. 1,722,726 1,364,220 1,588,250
Less: provisions for loan losses . . . .................................... 1,118,960 719,650 1,015,308
Net interest income after provisions for loan losses. . . ....................... 603,766 644,570 572,942
Other income (loss):
Gains on student loan securitizations .................................. — — 367,300
Servicing and securitization revenue .................................. 295,297 261,819 437,097
Gains (losses) on sales of loans and securities, net . ....................... 283,836 (186,155) (95,492)
Gains (losses) on derivative and hedging activities, net . . . . . ................ (604,535) (445,413) (1,360,584)
Contingency fee revenue .......................................... 295,883 340,140 335,737
Collections revenue . . . .......................................... 51,152 127,823 219,683
Guarantor servicing fees .......................................... 135,562 121,363 156,429
Other ....................................................... 929,151 392,076 385,303
Total other income. . .............................................. 1,386,346 611,653 445,473
Expenses:
Salaries and benefits . . . .......................................... 549,137 602,868 728,095
Other operating expenses.......................................... 706,169 712,083 759,895
Restructuring expenses . .......................................... 13,767 83,516 22,505
Total expenses . . . . .............................................. 1,269,073 1,398,467 1,510,495
Income (loss) from continuing operations, before income tax expense (benefit) . . . .... 721,039 (142,244) (492,080)
Income tax expense (benefit) ......................................... 238,364 (76,769) 408,275
Net income (loss) from continuing operations ............................. 482,675 (65,475) (900,355)
Income (loss) from discontinued operations, net of tax benefit . . ................ (157,690) (143,219) 6,276
Net income (loss) . . .............................................. 324,985 (208,694) (894,079)
Less: net income attributable to noncontrolling interest ....................... 847 3,932 2,315
Net income (loss) attributable to SLM Corporation ....................... 324,138 (212,626) (896,394)
Preferred stock dividends . .......................................... 145,836 111,206 37,145
Net income (loss) attributable to SLM Corporation common stock ............... $ 178,302 $ (323,832) $ (933,539)
Net income (loss) attributable to SLM Corporation:
Continuing operations, net of tax . . .................................... $ 481,828 $ (69,407) $ (902,670)
Discontinued operations, net of tax .................................... (157,690) (143,219) 6,276
Net income (loss) attributable to SLM Corporation . . . ....................... $ 324,138 $ (212,626) $ (896,394)
Basic earnings (loss) per common share attributable to SLM Corporation common
shareholders:
Continuing operations . . . .......................................... $ .71 $ (.39) $ (2.28)
Discontinued operations . . .......................................... $ (.33) $ (.30) $ .02
Total . . ....................................................... $ .38 $ (.69) $ (2.26)
Average common shares outstanding ................................... 470,858 466,642 412,233
Diluted earnings (loss) per common share attributable to SLM Corporation
common shareholders:
Continuing operations . . . .......................................... $ .71 $ (.39) $ (2.28)
Discontinued operations . . .......................................... $ (.33) $ (.30) $ .02
Total . . ....................................................... $ .38 $ (.69) $ (2.26)
Average common and common equivalent shares outstanding . . . ................ 471,584 466,642 412,233
Dividends per common share attributable to SLM Corporation common shareholders . . $ — $ — $ .25
See accompanying notes to consolidated financial statements.
F-5