Sallie Mae 2009 Annual Report Download - page 225
Download and view the complete annual report
Please find page 225 of the 2009 Sallie Mae annual report below. You can navigate through the pages in the report by either clicking on the pages listed below, or by using the keyword search tool below to find specific information within the annual report.-
 1
1 -
2
-
3
-
4
-
5
-
6
-
7
-
8
-
9
-
10
-
11
-
12
-
13
-
14
-
15
-
16
-
17
-
18
-
19
-
20
-
21
-
22
-
23
-
24
-
25
-
26
-
27
-
28
-
29
-
30
-
31
-
32
-
33
-
34
-
35
-
36
-
37
-
38
-
39
-
40
-
41
-
42
-
43
-
44
-
45
-
46
-
47
-
48
-
49
-
50
-
51
-
52
-
53
-
54
-
55
-
56
-
57
-
58
-
59
-
60
-
61
-
62
-
63
-
64
-
65
-
66
-
67
-
68
-
69
-
70
-
71
-
72
-
73
-
74
-
75
-
76
-
77
-
78
-
79
-
80
-
81
-
82
-
83
-
84
-
85
-
86
-
87
-
88
-
89
-
90
-
91
-
92
-
93
-
94
-
95
-
96
-
97
-
98
-
99
-
100
-
101
-
102
-
103
-
104
-
105
-
106
-
107
-
108
-
109
-
110
-
111
-
112
-
113
-
114
-
115
-
116
-
117
-
118
-
119
-
120
-
121
-
122
-
123
-
124
-
125
-
126
-
127
-
128
-
129
-
130
-
131
-
132
-
133
-
134
-
135
-
136
-
137
-
138
-
139
-
140
-
141
-
142
-
143
-
144
-
145
-
146
-
147
-
148
-
149
-
150
-
151
-
152
-
153
-
154
-
155
-
156
-
157
-
158
-
159
-
160
-
161
-
162
-
163
-
164
-
165
-
166
-
167
-
168
-
169
-
170
-
171
-
172
-
173
-
174
-
175
-
176
-
177
-
178
-
179
-
180
-
181
-
182
-
183
-
184
-
185
-
186
-
187
-
188
-
189
-
190
-
191
-
192
-
193
-
194
-
195
-
196
-
197
-
198
-
199
-
200
-
201
-
202
-
203
-
204
-
205
-
206
-
207
-
208
-
209
-
210
-
211
-
212
-
213
-
214
-
 215
215 -
 216
216 -
 217
217 -
 218
218 -
 219
219 -
 220
220 -
 221
221 -
 222
222 -
 223
223 -
 224
224 -
 225
225 -
 226
226 -
 227
227 -
 228
228 -
 229
229 -
 230
230 -
 231
231 -
 232
232 -
 233
233 -
 234
234 -
 235
235 -
236
-
237
-
238
-
239
-
240
-
241
-
242
-
243
-
244
-
245
-
246
-
247
-
248
-
249
-
250
-
251
-
252
-
253
-
254
-
255
-
256
 |
 |
20. Segment Reporting (Continued)
provided to colleges and universities which do not meet the required quantitative thresholds. Therefore, the
results of operations for these operating segments and the revenues and expenses associated with these other
products and services are combined with corporate overhead and other corporate activities within the
Corporate and Other reportable segment.
The management reporting process measures the performance of the Company’s operating segments
based on the management structure of the Company, as well as the methodology used by management to
evaluate performance and allocate resources. Management, including the Company’s chief operating decision
makers, evaluates the performance of the Company’s operating segments based on their profitability. As
discussed further below, management measures the profitability of the Company’s operating segments based
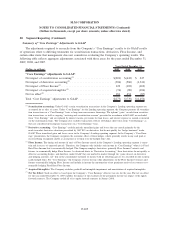
on “Core Earnings” net income. Accordingly, information regarding the Company’s reportable segments is
provided based on a “Core Earnings” basis. The Company’s “Core Earnings” performance measures are not
defined terms within GAAP and may not be comparable to similarly titled measures reported by other
companies. “Core Earnings” net income reflects only current period adjustments to GAAP net income as
described below. Unlike financial accounting, there is no comprehensive, authoritative guidance for manage-
ment reporting. The management reporting process measures the performance of the operating segments based
on the management structure of the Company and is not necessarily comparable with similar information for
any other financial institution. The Company’s operating segments are defined by the products and services
they offer or the types of customers they serve, and they reflect the manner in which financial information is
currently evaluated by management. Intersegment revenues and expenses are netted within the appropriate
financial statement line items consistent with the income statement presentation provided to management.
Changes in management structure or allocation methodologies and procedures may result in changes in
reported segment financial information.
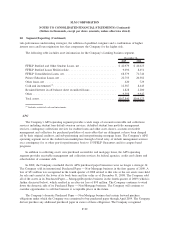
The Company’s principal operations are located in the United States, and its results of operations and
long-lived assets in geographic regions outside of the United States are not significant. In the Lending
segment, no individual customer accounted for more than 10 percent of its total revenue during the years
ended December 31, 2009, 2008 and 2007. United Student Aid Funds, Inc. (“USA Funds”) is the Company’s
largest customer in both the APG and Corporate and Other segments. During the years ended December 31,
2009, 2008 and 2007, USA Funds accounted for 16 percent, 46 percent and 35 percent, respectively, of the
aggregate revenues generated by the Company’s APG and Corporate and Other segments. No other customers
accounted for more than 10 percent of total revenues in those segments for the years mentioned.
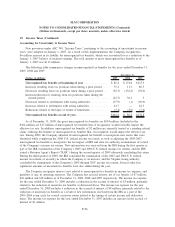
Lending
In the Company’s Lending operating segment, the Company originates and acquires both FFELP loans
and Private Education Loans. As of December 31, 2009, the Company managed $176.4 billion of student
loans, of which $141.3 billion or 80 percent are federally insured, and has 10 million student and parent
customers. The Company’s mortgage and other consumer loan portfolio totaled $363 million at December 31,
2009.
Private Education Loans consist of two general types: (1) those that are designed to bridge the gap
between the cost of higher education and the amount financed through either capped federally insured loans or
the borrowers’ resources, and (2) those that are used to meet the needs of students in alternative learning
programs such as career training, distance learning and lifelong learning programs. Most higher education
Private Education Loans are made in conjunction with a FFELP loan and as such are marketed through the
same channel as FFELP loans by the same sales force. Unlike FFELP loans, Private Education Loans are
subject to the full credit risk of the borrower. The Company manages this additional risk through historical
F-98
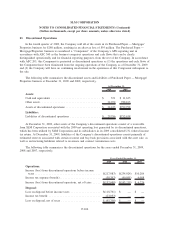
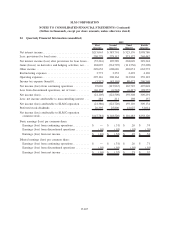
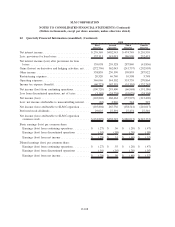
SLM CORPORATION
NOTES TO CONSOLIDATED FINANCIAL STATEMENTS (Continued)
(Dollars in thousands, except per share amounts, unless otherwise stated)