Sallie Mae 2009 Annual Report Download - page 81
Download and view the complete annual report
Please find page 81 of the 2009 Sallie Mae annual report below. You can navigate through the pages in the report by either clicking on the pages listed below, or by using the keyword search tool below to find specific information within the annual report.-
 1
1 -
2
-
3
-
4
-
5
-
6
-
7
-
8
-
9
-
10
-
11
-
12
-
13
-
14
-
15
-
16
-
17
-
18
-
19
-
20
-
21
-
22
-
23
-
24
-
25
-
26
-
27
-
28
-
29
-
30
-
31
-
32
-
33
-
34
-
35
-
36
-
37
-
38
-
39
-
40
-
41
-
42
-
43
-
44
-
45
-
46
-
47
-
48
-
49
-
50
-
51
-
52
-
53
-
54
-
55
-
56
-
57
-
58
-
59
-
60
-
61
-
62
-
63
-
64
-
65
-
66
-
67
-
68
-
69
-
70
-
 71
71 -
 72
72 -
 73
73 -
 74
74 -
 75
75 -
 76
76 -
 77
77 -
 78
78 -
 79
79 -
 80
80 -
 81
81 -
 82
82 -
 83
83 -
 84
84 -
 85
85 -
 86
86 -
 87
87 -
 88
88 -
 89
89 -
 90
90 -
 91
91 -
92
-
93
-
94
-
95
-
96
-
97
-
98
-
99
-
100
-
101
-
102
-
103
-
104
-
105
-
106
-
107
-
108
-
109
-
110
-
111
-
112
-
113
-
114
-
115
-
116
-
117
-
118
-
119
-
120
-
121
-
122
-
123
-
124
-
125
-
126
-
127
-
128
-
129
-
130
-
131
-
132
-
133
-
134
-
135
-
136
-
137
-
138
-
139
-
140
-
141
-
142
-
143
-
144
-
145
-
146
-
147
-
148
-
149
-
150
-
151
-
152
-
153
-
154
-
155
-
156
-
157
-
158
-
159
-
160
-
161
-
162
-
163
-
164
-
165
-
166
-
167
-
168
-
169
-
170
-
171
-
172
-
173
-
174
-
175
-
176
-
177
-
178
-
179
-
180
-
181
-
182
-
183
-
184
-
185
-
186
-
187
-
188
-
189
-
190
-
191
-
192
-
193
-
194
-
195
-
196
-
197
-
198
-
199
-
200
-
201
-
202
-
203
-
204
-
205
-
206
-
207
-
208
-
209
-
210
-
211
-
212
-
213
-
214
-
215
-
216
-
217
-
218
-
219
-
220
-
221
-
222
-
223
-
224
-
225
-
226
-
227
-
228
-
229
-
230
-
231
-
232
-
233
-
234
-
235
-
236
-
237
-
238
-
239
-
240
-
241
-
242
-
243
-
244
-
245
-
246
-
247
-
248
-
249
-
250
-
251
-
252
-
253
-
254
-
255
-
256
 |
 |

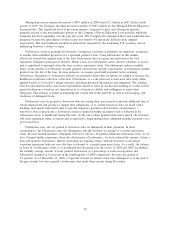
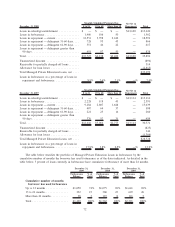
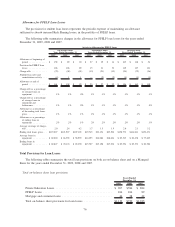
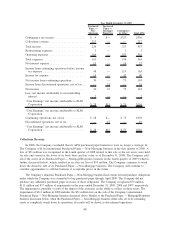
The following table includes on-balance sheet asset information for our Lending business segment.
2009 2008
December 31,
FFELP Stafford and Other Student Loans, net ....................... $ 42,979 $ 44,025
FFELP Stafford Loans Held-for-Sale .............................. 9,696 8,451
FFELP Consolidation Loans, net ................................. 68,379 71,744
Private Education Loans, net .................................... 22,753 20,582
Other loans, net.............................................. 420 729
Investments
(1)
............................................... 12,387 8,445
Retained Interest in off-balance sheet securitized loans . . ............... 1,828 2,200
Other
(2)
.................................................... 9,398 9,947
Total assets ................................................. $167,840 $166,123
(1)
Investments include cash and cash equivalents, short and long-term investments, restricted cash and investments, leveraged leases,
and municipal bonds.
(2)
Other assets include accrued interest receivable, goodwill and acquired intangible assets and other non-interest-earning assets.
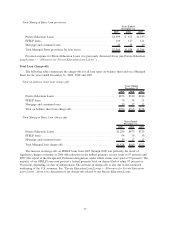
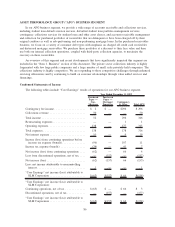
Loan Originations
The Company originates loans under its own brand names, which we refer to as internal lending brands,
and also through Lender Partners under forward contracts to purchase loans at contractual prices. In the past,
we referred to these combined channels as Preferred Channel Originations. As discussed at the beginning of
this “LENDING BUSINESS SEGMENT,” legislative changes and credit market conditions have resulted in
other FFELP lenders reducing their participation in the FFELP program.
As a result of the impacts described above, our FFELP internal brand originations were up sharply in
2009, increasing 40 percent from the prior year. Our FFELP lender partner originations declined 42 percent
from 2008 to 2009. A number of these Lender Partners, including some of our largest originators have
converted to third-party servicing arrangements in which we service loans on their behalf. Combined, total
FFELP loan originations increased 21 percent in 2009.
Total Private Education Loan originations declined 50 percent from the prior year to $3.2 billion in the
year ended December 31, 2009, as a result of a continued tightening of our underwriting criteria, an increase
in guaranteed student loan limits and the Company’s withdrawal from certain markets.
At December 31, 2009, the Company was committed to purchase $1.3 billion of loans originated by our
Lender Partners ($820 million of FFELP loans and $456 million of Private Education Loans). Approximately
$240 million of these FFELP loans were originated prior to CCRAA. Approximately $533 million of these
FFELP loans are eligible for ED’s Purchase and Participation Programs (see “LIQUIDITY AND CAPITAL
RESOURCES — ED Funding Programs”).
80