Sallie Mae 2009 Annual Report Download - page 7
Download and view the complete annual report
Please find page 7 of the 2009 Sallie Mae annual report below. You can navigate through the pages in the report by either clicking on the pages listed below, or by using the keyword search tool below to find specific information within the annual report.-
 1
1 -
 2
2 -
 3
3 -
 4
4 -
 5
5 -
 6
6 -
 7
7 -
 8
8 -
 9
9 -
 10
10 -
 11
11 -
 12
12 -
 13
13 -
 14
14 -
 15
15 -
 16
16 -
 17
17 -
 18
18 -
19
-
20
-
21
-
22
-
23
-
24
-
25
-
26
-
27
-
28
-
29
-
30
-
31
-
32
-
33
-
34
-
35
-
36
-
37
-
38
-
39
-
40
-
41
-
42
-
43
-
44
-
45
-
46
-
47
-
48
-
49
-
50
-
51
-
52
-
53
-
54
-
55
-
56
-
57
-
58
-
59
-
60
-
61
-
62
-
63
-
64
-
65
-
66
-
67
-
68
-
69
-
70
-
71
-
72
-
73
-
74
-
75
-
76
-
77
-
78
-
79
-
80
-
81
-
82
-
83
-
84
-
85
-
86
-
87
-
88
-
89
-
90
-
91
-
92
-
93
-
94
-
95
-
96
-
97
-
98
-
99
-
100
-
101
-
102
-
103
-
104
-
105
-
106
-
107
-
108
-
109
-
110
-
111
-
112
-
113
-
114
-
115
-
116
-
117
-
118
-
119
-
120
-
121
-
122
-
123
-
124
-
125
-
126
-
127
-
128
-
129
-
130
-
131
-
132
-
133
-
134
-
135
-
136
-
137
-
138
-
139
-
140
-
141
-
142
-
143
-
144
-
145
-
146
-
147
-
148
-
149
-
150
-
151
-
152
-
153
-
154
-
155
-
156
-
157
-
158
-
159
-
160
-
161
-
162
-
163
-
164
-
165
-
166
-
167
-
168
-
169
-
170
-
171
-
172
-
173
-
174
-
175
-
176
-
177
-
178
-
179
-
180
-
181
-
182
-
183
-
184
-
185
-
186
-
187
-
188
-
189
-
190
-
191
-
192
-
193
-
194
-
195
-
196
-
197
-
198
-
199
-
200
-
201
-
202
-
203
-
204
-
205
-
206
-
207
-
208
-
209
-
210
-
211
-
212
-
213
-
214
-
215
-
216
-
217
-
218
-
219
-
220
-
221
-
222
-
223
-
224
-
225
-
226
-
227
-
228
-
229
-
230
-
231
-
232
-
233
-
234
-
235
-
236
-
237
-
238
-
239
-
240
-
241
-
242
-
243
-
244
-
245
-
246
-
247
-
248
-
249
-
250
-
251
-
252
-
253
-
254
-
255
-
256
 |
 |
BUSINESS SEGMENTS
We provide credit products and related services to the higher education and consumer credit communities
and others through two primary business segments: our Lending business segment and our Asset Performance
Group (“APG”) business segment. In addition, within our Corporate and Other business segment, we provide a
number of products and services that are managed within smaller operating segments, the most prominent
being our Guarantor Servicing and Loan Servicing businesses. As discussed above, some of our businesses are
expected to go into run-off as a result of pending legislation. Each of these segments is summarized below.
The accounting treatment for the segments is explained in “MANAGEMENT’S DISCUSSION AND ANAL-
YSIS OF FINANCIAL CONDITION AND RESULTS OF OPERATIONS.”
LENDING BUSINESS SEGMENT
In the Lending business segment, we originate and acquire both federally guaranteed student loans, and
Private Education Loans, which are not federally guaranteed. We manage the largest portfolio of FFELP and
Private Education Loans in the student loan industry, and have 10 million student and parent customers
through our ownership and management of $176.4 billion in Managed student loans as of December 31, 2009,
of which $141.4 billion or 80 percent are federally insured. We serve over 6,000 clients, including educational
and financial institutions and non-profit state agencies. We are the largest servicer and collector of student
loans, servicing $194.2 billion in assets, including $26.3 billion for third parties, of which $19.2 billion is
serviced for ED as of December 31, 2009.
Sallie Mae’s Lending Business
Our primary marketing point-of-contact is the school’s financial aid office. We deliver flexible and cost-
effective products to the school and its students. The focus of our sales force is to market Sallie Mae’s suite of
education finance products to colleges. These include FFELP and Private Education Loans and through our
Web-based loan origination and servicing platform OpenNet». As a result of the changes taking place in the
student loan marketplace, we are broadening our marketing activities to include Direct to Consumer initiatives
and referral lending relationships. We also intend to drive loan volume through our Planning, Paying and
Saving for college activities.
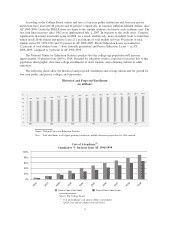
In 2009, we originated $24.9 billion in student loans. FFELP originations for the year ended December 31,
2009 totaled $21.7 billion, an increase of 21 percent from the year ended December 31, 2008. The increase in
FFELP loan origination growth was due to higher loan limits and an increase in market share. Given the
legislative uncertainty around FFELP and the ongoing transition of certain schools to Direct Lending, FFELP
originations could be substantially lower in the AY 2010–2011. Private Education Loan originations totaled
$3.2 billion, a decrease of 50 percent from the prior year. The decline in Private Education Loan originations
was due to a tightening of our underwriting requirements, an increase in federal student loan limits and the
Company’s withdrawal from certain markets.
Private Education Loans
We bear the full credit risk for Private Education Loans, which are underwritten and priced according to
credit risk based upon customized credit scoring criteria. Due to their higher risk profile, generally Private
Education Loans have higher interest rates than FFELP loans. Despite a decline in the growth rate of Private
Education Loan originations, the portfolio grew 5 percent from the prior year. All new Private Education
Loans are being funded at Sallie Mae Bank through our deposit taking activities.
In 2008 and 2009, the credit environment created significant challenges for funding Private Education
Loans. At the same time, we became more restrictive in our underwriting criteria. In addition, as discussed
above, federal lending limits increased significantly in 2007 and 2008. As a result of these factors, originations
declined in 2008 and 2009. We expect originations to grow once again in 2010 and subsequent years as the
credit markets continue to recover and the impact of the 2007 and 2008 federal loan limit increases is offset
by tuition increases and market share gains.
6