Sallie Mae 2009 Annual Report Download - page 83
Download and view the complete annual report
Please find page 83 of the 2009 Sallie Mae annual report below. You can navigate through the pages in the report by either clicking on the pages listed below, or by using the keyword search tool below to find specific information within the annual report.-
 1
1 -
2
-
3
-
4
-
5
-
6
-
7
-
8
-
9
-
10
-
11
-
12
-
13
-
14
-
15
-
16
-
17
-
18
-
19
-
20
-
21
-
22
-
23
-
24
-
25
-
26
-
27
-
28
-
29
-
30
-
31
-
32
-
33
-
34
-
35
-
36
-
37
-
38
-
39
-
40
-
41
-
42
-
43
-
44
-
45
-
46
-
47
-
48
-
49
-
50
-
51
-
52
-
53
-
54
-
55
-
56
-
57
-
58
-
59
-
60
-
61
-
62
-
63
-
64
-
65
-
66
-
67
-
68
-
69
-
70
-
71
-
72
-
 73
73 -
 74
74 -
 75
75 -
 76
76 -
 77
77 -
 78
78 -
 79
79 -
 80
80 -
 81
81 -
 82
82 -
 83
83 -
 84
84 -
 85
85 -
 86
86 -
 87
87 -
 88
88 -
 89
89 -
 90
90 -
 91
91 -
 92
92 -
 93
93 -
94
-
95
-
96
-
97
-
98
-
99
-
100
-
101
-
102
-
103
-
104
-
105
-
106
-
107
-
108
-
109
-
110
-
111
-
112
-
113
-
114
-
115
-
116
-
117
-
118
-
119
-
120
-
121
-
122
-
123
-
124
-
125
-
126
-
127
-
128
-
129
-
130
-
131
-
132
-
133
-
134
-
135
-
136
-
137
-
138
-
139
-
140
-
141
-
142
-
143
-
144
-
145
-
146
-
147
-
148
-
149
-
150
-
151
-
152
-
153
-
154
-
155
-
156
-
157
-
158
-
159
-
160
-
161
-
162
-
163
-
164
-
165
-
166
-
167
-
168
-
169
-
170
-
171
-
172
-
173
-
174
-
175
-
176
-
177
-
178
-
179
-
180
-
181
-
182
-
183
-
184
-
185
-
186
-
187
-
188
-
189
-
190
-
191
-
192
-
193
-
194
-
195
-
196
-
197
-
198
-
199
-
200
-
201
-
202
-
203
-
204
-
205
-
206
-
207
-
208
-
209
-
210
-
211
-
212
-
213
-
214
-
215
-
216
-
217
-
218
-
219
-
220
-
221
-
222
-
223
-
224
-
225
-
226
-
227
-
228
-
229
-
230
-
231
-
232
-
233
-
234
-
235
-
236
-
237
-
238
-
239
-
240
-
241
-
242
-
243
-
244
-
245
-
246
-
247
-
248
-
249
-
250
-
251
-
252
-
253
-
254
-
255
-
256
 |
 |

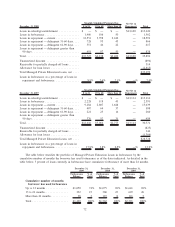
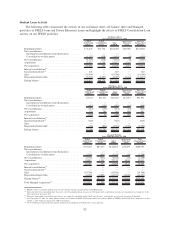
Student Loan Activity
The following tables summarize the activity in our on-balance sheet, off-balance sheet and Managed
portfolios of FFELP loans and Private Education Loans and highlight the effects of FFELP Consolidation Loan
activity on our FFELP portfolios.
FFELP
Stafford and
Other
(1)
FFELP
Consolidation
Loans
Total
FFELP
Total Private
Education
Loans
Total On-
Balance Sheet
Portfolio
On-Balance Sheet
Years Ended December 31, 2009
Beginning balance . ........................... $52,476 $71,744 $124,220 $20,582 $144,802
Net consolidations:
Incremental consolidations from third parties . . ....... — — — — —
Consolidations to third parties . . ................. (1,113) (518) (1,631) (8) (1,639)
Net consolidations . ........................... (1,113) (518) (1,631) (8) (1,639)
Acquisitions ................................ 25,677 1,150 26,827 4,343 31,170
Net acquisitions . . ........................... 24,564 632 25,196 4,335 29,531
Internal consolidations
(2)
........................ — — — — —
Securitization-related
(3)
......................... 645 — 645 — 645
Sales..................................... (19,300) — (19,300) — (19,300)
Repayments/claims/other . . ...................... (5,710) (3,997) (9,707) (2,164) (11,871)
Ending balance . . . ........................... $52,675 $68,379 $121,054 $22,753 $143,807
FFELP
Stafford and
Other
(1)
FFELP
Consolidation
Loans
Total
FFELP
Total Private
Education
Loans
Total Off-
Balance Sheet
Portfolio
Off-Balance Sheet
Years Ended December 31, 2009
Beginning balance ............................. $7,143 $15,531 $22,674 $12,917 $35,591
Net consolidations:
Incremental consolidations from third parties .......... — — — — —
Consolidations to third parties ................... (413) (138) (551) (18) (569)
Net consolidations ............................. (413) (138) (551) (18) (569)
Acquisitions . . . .............................. 135 208 343 498 841
Net acquisitions .............................. (278) 70 (208) 480 272
Internal consolidations
(2)
......................... — — — — —
Securitization-related
(3)
......................... (645) — (645) — (645)
Sales . . ................................... — — — — —
Repayments/claims/other ........................ (720) (804) (1,524) (1,056) (2,580)
Ending balance . .............................. $5,500 $14,797 $20,297 $12,341 $32,638
FFELP
Stafford and
Other
(1)
FFELP
Consolidation
Loans
Total
FFELP
Total Private
Education
Loans
Total
Managed Basis
Portfolio
Managed Portfolio
Years Ended December 31, 2009
Beginning balance ........................... $59,619 $87,275 $146,894 $33,499 $180,393
Net consolidations:
Incremental consolidations from third parties ........ — — — — —
Consolidations to third parties .................. (1,526) (656) (2,182) (26) (2,208)
Net consolidations ........................... (1,526) (656) (2,182) (26) (2,208)
Acquisitions . . . ............................ 25,812 1,358 27,170 4,841 32,011
Net acquisitions . ............................ 24,286 702 24,988 4,815 29,803
Internal consolidations
(2)
....................... — — — — —
Securitization-related
(3)
........................ — — — — —
Sales . . . ................................. (19,300) — (19,300) — (19,300)
Repayments/claims/other ....................... (6,430) (4,801) (11,231) (3,220) (14,451)
Ending balance
(4)
............................ $58,175 $83,176 $141,351 $35,094 $176,445
Total Managed Acquisitions
(5)
.................... $25,812 $ 1,358 $ 27,170 $ 4,841 $ 32,011
(1)
FFELP category is primarily Stafford Loans but also includes federally guaranteed PLUS and HEAL Loans.
(2)
Represents borrowers consolidating their loans into a new Consolidation Loan. Loans in our off-balance sheet securitization trusts that are consolidated are bought out of the
trusts and moved on-balance sheet.
(3)
Represents loans within securitization trusts that we are required to consolidate under GAAP once the trusts’ loan balances are below the clean-up call threshold.
(4)
As of December 31, 2009, the ending balance includes $15.9 billion of FFELP Stafford and Other Loans and $2.6 billion of FFELP Consolidation Loans disbursed on or after
October 1, 2007, which are impacted by CCRAA legislation.
(5)
The Total Managed Acquisitions line includes incremental consolidations from third parties and acquisitions.
82