Sallie Mae 2009 Annual Report Download - page 193
Download and view the complete annual report
Please find page 193 of the 2009 Sallie Mae annual report below. You can navigate through the pages in the report by either clicking on the pages listed below, or by using the keyword search tool below to find specific information within the annual report.-
 1
1 -
2
-
3
-
4
-
5
-
6
-
7
-
8
-
9
-
10
-
11
-
12
-
13
-
14
-
15
-
16
-
17
-
18
-
19
-
20
-
21
-
22
-
23
-
24
-
25
-
26
-
27
-
28
-
29
-
30
-
31
-
32
-
33
-
34
-
35
-
36
-
37
-
38
-
39
-
40
-
41
-
42
-
43
-
44
-
45
-
46
-
47
-
48
-
49
-
50
-
51
-
52
-
53
-
54
-
55
-
56
-
57
-
58
-
59
-
60
-
61
-
62
-
63
-
64
-
65
-
66
-
67
-
68
-
69
-
70
-
71
-
72
-
73
-
74
-
75
-
76
-
77
-
78
-
79
-
80
-
81
-
82
-
83
-
84
-
85
-
86
-
87
-
88
-
89
-
90
-
91
-
92
-
93
-
94
-
95
-
96
-
97
-
98
-
99
-
100
-
101
-
102
-
103
-
104
-
105
-
106
-
107
-
108
-
109
-
110
-
111
-
112
-
113
-
114
-
115
-
116
-
117
-
118
-
119
-
120
-
121
-
122
-
123
-
124
-
125
-
126
-
127
-
128
-
129
-
130
-
131
-
132
-
133
-
134
-
135
-
136
-
137
-
138
-
139
-
140
-
141
-
142
-
143
-
144
-
145
-
146
-
147
-
148
-
149
-
150
-
151
-
152
-
153
-
154
-
155
-
156
-
157
-
158
-
159
-
160
-
161
-
162
-
163
-
164
-
165
-
166
-
167
-
168
-
169
-
170
-
171
-
172
-
173
-
174
-
175
-
176
-
177
-
178
-
179
-
180
-
181
-
182
-
 183
183 -
 184
184 -
 185
185 -
 186
186 -
 187
187 -
 188
188 -
 189
189 -
 190
190 -
 191
191 -
 192
192 -
 193
193 -
 194
194 -
 195
195 -
 196
196 -
 197
197 -
 198
198 -
 199
199 -
 200
200 -
 201
201 -
 202
202 -
 203
203 -
204
-
205
-
206
-
207
-
208
-
209
-
210
-
211
-
212
-
213
-
214
-
215
-
216
-
217
-
218
-
219
-
220
-
221
-
222
-
223
-
224
-
225
-
226
-
227
-
228
-
229
-
230
-
231
-
232
-
233
-
234
-
235
-
236
-
237
-
238
-
239
-
240
-
241
-
242
-
243
-
244
-
245
-
246
-
247
-
248
-
249
-
250
-
251
-
252
-
253
-
254
-
255
-
256
 |
 |

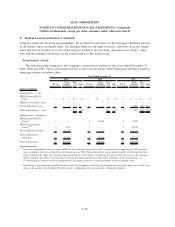
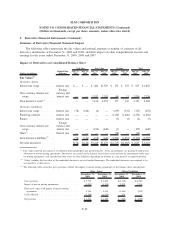
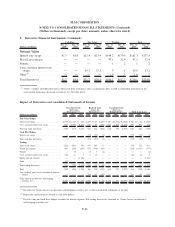
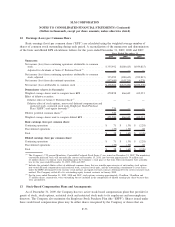
9. Derivative Financial Instruments (Continued)
(Dollars in billions)
Dec. 31,
2009
Dec. 31,
2008
Dec. 31,
2009
Dec. 31,
2008
Dec. 31,
2009
Dec. 31,
2008
Dec. 31,
2009
Dec. 31,
2008
Cash Flow Fair Value Trading Total
Notional Values
Interest rate swaps .......... $1.7 $4.8 $12.4 $13.4 $148.2 $159.3 $162.3 $177.5
Floor/Cap contracts .......... — — — — 47.1 32.4 47.1 32.4
Futures ................... — — — — .1 .2 .1 .2
Cross currency interest rate
swaps .................. — — 19.3 23.1 .3 .1 19.6 23.2
Other
(1)
................... — — — — 1.0 .7 1.0 .7
Total derivatives ............ $1.7 $4.8 $31.7 $36.5 $196.7 $192.7 $230.1 $234.0
(1)
“Other” includes embedded derivatives bifurcated from on-balance sheet securitization debt, as well as embedded derivatives in the
asset-backed financings discussed in footnote 2 to the table above.
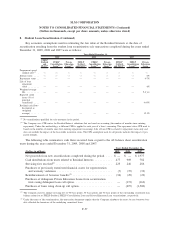
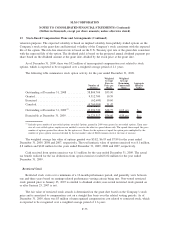
Impact of Derivatives on Consolidated Statements of Income
(Dollars in millions) 2009 2008 2007 2009 2008 2007 2009 2008 2007 2009 2008 2007
Realized Gain
(Loss) on
Derivatives
(3)
Unrealized Gain
(Loss) on
Derivatives
(1)(2)
Unrealized Gain
(Loss) on
Hedged Item
(1)
Total Gain (Loss)
Fair Value Hedges
Interest rate swaps . .................. $(801) $ 1,427 $ 458 $ 403 $ 157 $(155) $ 850 $(1,532) $ (468) $ 452 $ 52 $ (165)
Cross currency interest rate swaps . ......... 692 (1,537) 2,200 440 67 (139) (934) 1,864 (2,129) 198 394 (68)
Total fair value derivatives .............. (109) (110) 2,658 843 224 (294) (84) 332 (2,597) 650 446 (233)
Cash Flow Hedges
Interest rate swaps . .................. 2 — — (75) (37) (1) — — — (73) (37) (1)
Total cash flow derivatives .............. 2 — — (75) (37) (1) — — — (73) (37) (1)
Trading
Interest rate swaps . .................. (526) (261) 360 433 584 51 — — — (93) 323 411
Floor/Cap contracts .................. 483 (529) (209) (717) (488) (68) — — — (234) (1,017) (277)
Futures . . . ....................... 1 (3) — (1) 3 (1) — — — — — (1)
Cross currency interest rate swaps . ......... (26) 11 3 4 16 — — — — (22) 27 3
Equity forward contracts . .............. — — (1,558) — — — — — — — — (1,558)
Other ........................... (65) — — 1 — — — — — (64) — —
Total trading derivatives . . .............. (133) (782) (1,404) (280) 115 (18) — — — (413) (667) (1,422)
Total ........................... (240) (892) 1,254 488 302 (313) (84) 332 (2,597) 164 (258) (1,656)
Less: realized gains (losses) recorded in interest
expense . ....................... — — — 768 187 (295) — — — 768 187 (295)
Gains (losses) on derivative and hedging
activities, net . . . .................. $(240) $ (892) $ 1,254 $(280) $ 115 $ (18) $ (84) $ 332 $(2,597) $(604) $ (445) $(1,361)
(1)
Recorded in “Gains (losses) on derivative and hedging activities, net” in the consolidated statements of income.
(2)
Represents ineffectiveness related to cash flow hedges.
(3)
For fair value and cash flow hedges, recorded in interest expense. For trading derivatives, recorded in “Gains (losses) on derivative
and hedging activities, net.”
F-66
SLM CORPORATION
NOTES TO CONSOLIDATED FINANCIAL STATEMENTS (Continued)
(Dollars in thousands, except per share amounts, unless otherwise stated)