Sallie Mae 2009 Annual Report Download - page 186
Download and view the complete annual report
Please find page 186 of the 2009 Sallie Mae annual report below. You can navigate through the pages in the report by either clicking on the pages listed below, or by using the keyword search tool below to find specific information within the annual report.-
 1
1 -
2
-
3
-
4
-
5
-
6
-
7
-
8
-
9
-
10
-
11
-
12
-
13
-
14
-
15
-
16
-
17
-
18
-
19
-
20
-
21
-
22
-
23
-
24
-
25
-
26
-
27
-
28
-
29
-
30
-
31
-
32
-
33
-
34
-
35
-
36
-
37
-
38
-
39
-
40
-
41
-
42
-
43
-
44
-
45
-
46
-
47
-
48
-
49
-
50
-
51
-
52
-
53
-
54
-
55
-
56
-
57
-
58
-
59
-
60
-
61
-
62
-
63
-
64
-
65
-
66
-
67
-
68
-
69
-
70
-
71
-
72
-
73
-
74
-
75
-
76
-
77
-
78
-
79
-
80
-
81
-
82
-
83
-
84
-
85
-
86
-
87
-
88
-
89
-
90
-
91
-
92
-
93
-
94
-
95
-
96
-
97
-
98
-
99
-
100
-
101
-
102
-
103
-
104
-
105
-
106
-
107
-
108
-
109
-
110
-
111
-
112
-
113
-
114
-
115
-
116
-
117
-
118
-
119
-
120
-
121
-
122
-
123
-
124
-
125
-
126
-
127
-
128
-
129
-
130
-
131
-
132
-
133
-
134
-
135
-
136
-
137
-
138
-
139
-
140
-
141
-
142
-
143
-
144
-
145
-
146
-
147
-
148
-
149
-
150
-
151
-
152
-
153
-
154
-
155
-
156
-
157
-
158
-
159
-
160
-
161
-
162
-
163
-
164
-
165
-
166
-
167
-
168
-
169
-
170
-
171
-
172
-
173
-
174
-
175
-
 176
176 -
 177
177 -
 178
178 -
 179
179 -
 180
180 -
 181
181 -
 182
182 -
 183
183 -
 184
184 -
 185
185 -
 186
186 -
 187
187 -
 188
188 -
 189
189 -
 190
190 -
 191
191 -
 192
192 -
 193
193 -
 194
194 -
 195
195 -
 196
196 -
197
-
198
-
199
-
200
-
201
-
202
-
203
-
204
-
205
-
206
-
207
-
208
-
209
-
210
-
211
-
212
-
213
-
214
-
215
-
216
-
217
-
218
-
219
-
220
-
221
-
222
-
223
-
224
-
225
-
226
-
227
-
228
-
229
-
230
-
231
-
232
-
233
-
234
-
235
-
236
-
237
-
238
-
239
-
240
-
241
-
242
-
243
-
244
-
245
-
246
-
247
-
248
-
249
-
250
-
251
-
252
-
253
-
254
-
255
-
256
 |
 |
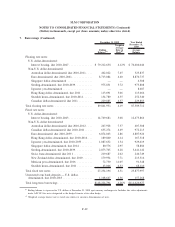
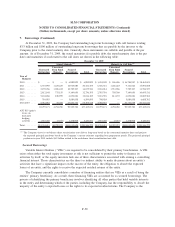
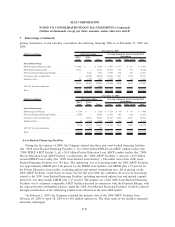
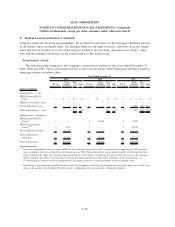
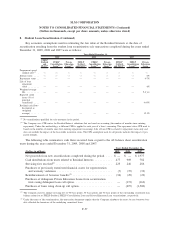
8. Student Loan Securitization (Continued)
Servicing and securitization revenue is primarily driven by the average balance of off-balance sheet
student loans, the amount of and the difference in the timing of Embedded Floor Income recognition for off-
balance sheet student loans, and the fair value adjustment related to those Residual Interests where the
Company has elected to carry such Residual Interests at fair value through earnings under ASC 825.
The Company recorded net unrealized mark-to-market losses of $330 million, $425 million and $24 million
in the years ended December 31, 2009, 2008 and 2007, respectively, related to the Residual Interest.
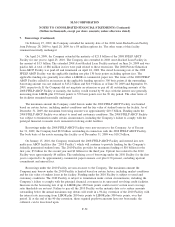
As of December 31, 2009, the Company changed the following significant assumptions compared to
those used as of December 31, 2008, to determine the fair value of the Residual Interests:
• Prepayment speed assumptions on FFELP Stafford and Consolidation Loans were decreased. This change
reflects the significant decrease in prepayment activity experienced since 2008. This decrease in
prepayment activity, which the Company expects will continue into the foreseeable future, was primarily
due to a reduction in third-party consolidation activity as a result of the CCRAA and the current
U.S. economic and credit environment. This resulted in a $61 million unrealized mark-to-market gain.
• Life of loan default rate assumptions for Private Education Loans were increased from 9.1 percent to
12.2 percent as a result of the continued weakening of the U.S. economy. This resulted in a $426 million
unrealized mark-to-market loss.
As of December 31, 2008, the Company had changed the following significant assumptions compared to
those used as of December 31, 2007, to determine the fair value of the Residual Interests:
• Prepayment speed assumptions were decreased for all three asset types primarily as a result of a
significant reduction in prepayment activity experienced, which is expected to continue into the
foreseeable future. The decrease in prepayment speeds was primarily due to a reduction in third-party
consolidation activity as a result of the CCRAA (for FFELP only) and the current U.S. economic and
credit environment. This resulted in a $114 million unrealized mark-to-market gain.
• Life of loan default rate assumptions for Private Education Loans were increased as a result of the
continued weakening of the U.S. economy. This resulted in a $79 million unrealized mark-to-market loss.
• Cost of funds assumptions related to the underlying auction rate securities bonds ($2.3 billion face
amount of bonds) within FFELP loan ($1.7 billion face amount of bonds) and Private Education Loan
($0.6 billion face amount of bonds) trusts were increased to take into account the expectations these
auction rate securities would continue to reset at higher rates for an extended period of time. This
resulted in a $116 million unrealized mark-to-market loss.
• The discount rate assumption related to the Private Education Loan and FFELP Residual Interests was
increased. The Company assessed the appropriateness of the current risk premium, which was added to the
risk free rate for the purpose of arriving at a discount rate, in light of the current economic and credit
uncertainty that existed in the market as of December 31, 2008. This discount rate was applied to the
projected cash flows to arrive at a fair value representative of the then current economic conditions. The
Company increased the risk premium by 1,550 basis points and 390 basis points for Private Education Loans
and FFELP loans, respectively, to take into account the then current level of cash flow uncertainty and lack
of liquidity that existed with the Residual Interests. This resulted in a $904 million unrealized mark-to-market
loss.
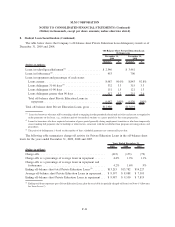
The Company recorded impairments to the Retained Interests of $254 million for the year ended
December 31, 2007. The impairment charges were the result of FFELP loans prepaying faster than projected
through loan consolidations ($110 million), impairment to the Floor Income component of the Company’s
F-59
SLM CORPORATION
NOTES TO CONSOLIDATED FINANCIAL STATEMENTS (Continued)
(Dollars in thousands, except per share amounts, unless otherwise stated)