Sallie Mae 2009 Annual Report Download - page 206
Download and view the complete annual report
Please find page 206 of the 2009 Sallie Mae annual report below. You can navigate through the pages in the report by either clicking on the pages listed below, or by using the keyword search tool below to find specific information within the annual report.-
 1
1 -
2
-
3
-
4
-
5
-
6
-
7
-
8
-
9
-
10
-
11
-
12
-
13
-
14
-
15
-
16
-
17
-
18
-
19
-
20
-
21
-
22
-
23
-
24
-
25
-
26
-
27
-
28
-
29
-
30
-
31
-
32
-
33
-
34
-
35
-
36
-
37
-
38
-
39
-
40
-
41
-
42
-
43
-
44
-
45
-
46
-
47
-
48
-
49
-
50
-
51
-
52
-
53
-
54
-
55
-
56
-
57
-
58
-
59
-
60
-
61
-
62
-
63
-
64
-
65
-
66
-
67
-
68
-
69
-
70
-
71
-
72
-
73
-
74
-
75
-
76
-
77
-
78
-
79
-
80
-
81
-
82
-
83
-
84
-
85
-
86
-
87
-
88
-
89
-
90
-
91
-
92
-
93
-
94
-
95
-
96
-
97
-
98
-
99
-
100
-
101
-
102
-
103
-
104
-
105
-
106
-
107
-
108
-
109
-
110
-
111
-
112
-
113
-
114
-
115
-
116
-
117
-
118
-
119
-
120
-
121
-
122
-
123
-
124
-
125
-
126
-
127
-
128
-
129
-
130
-
131
-
132
-
133
-
134
-
135
-
136
-
137
-
138
-
139
-
140
-
141
-
142
-
143
-
144
-
145
-
146
-
147
-
148
-
149
-
150
-
151
-
152
-
153
-
154
-
155
-
156
-
157
-
158
-
159
-
160
-
161
-
162
-
163
-
164
-
165
-
166
-
167
-
168
-
169
-
170
-
171
-
172
-
173
-
174
-
175
-
176
-
177
-
178
-
179
-
180
-
181
-
182
-
183
-
184
-
185
-
186
-
187
-
188
-
189
-
190
-
191
-
192
-
193
-
194
-
195
-
 196
196 -
 197
197 -
 198
198 -
 199
199 -
 200
200 -
 201
201 -
 202
202 -
 203
203 -
 204
204 -
 205
205 -
 206
206 -
 207
207 -
 208
208 -
 209
209 -
 210
210 -
 211
211 -
 212
212 -
 213
213 -
 214
214 -
 215
215 -
 216
216 -
217
-
218
-
219
-
220
-
221
-
222
-
223
-
224
-
225
-
226
-
227
-
228
-
229
-
230
-
231
-
232
-
233
-
234
-
235
-
236
-
237
-
238
-
239
-
240
-
241
-
242
-
243
-
244
-
245
-
246
-
247
-
248
-
249
-
250
-
251
-
252
-
253
-
254
-
255
-
256
 |
 |

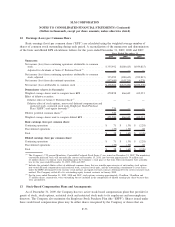
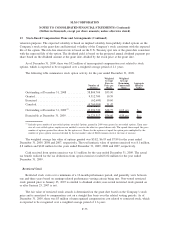
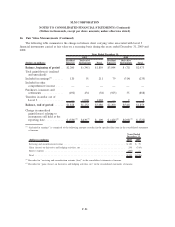
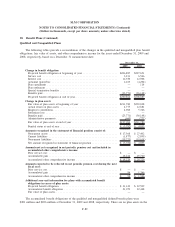
15. Restructuring Activities (Continued)
The following table summarizes the restructuring expenses incurred to date.
2009 2008 2007
Cumulative Expense
as of December 31,
2009
Years Ended December 31,
Severance costs ....................... $11,196 $62,599 $22,505 $ 96,300
Lease and other contract termination costs . . . 890 9,517 — 10,407
Exit and other costs .................... 1,681 11,400 — 13,081
Total restructuring from continuing
operations
(1)
........................ 13,767 83,516 22,505 119,788
Total restructuring from discontinued
operations ......................... 8,462 259 — 8,721
Total ............................... $22,229 $83,775 $22,505 $128,509
(1)
Aggregate restructuring expenses from continuing operations incurred across the Company’s reportable segments during the
years ended December 31, 2009, 2008 and 2007 totaled $10 million, $49 million and $19 million, respectively, in the Company’s
Lending reportable segment; $1 million, $11 million and $2 million, respectively, in the Company’s APG reportable segment;
and $3 million, $23 million and $2 million, respectively, in the Company’s Corporate and Other reportable segment.
Since its inception in the fourth quarter of 2007 through December 31, 2009, cumulative severance costs
were incurred in conjunction with aggregate completed and planned position eliminations of approximately
2,900 positions. Position eliminations were across all of the Company’s reportable segments, ranging from
senior executives to servicing center personnel. Lease and other contract termination costs and exit and other
costs incurred during 2009 and 2008 related primarily to terminated or abandoned facility leases and
consulting costs incurred in conjunction with various cost reduction and exit strategies.
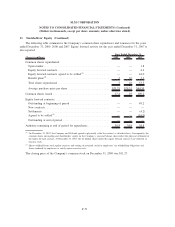
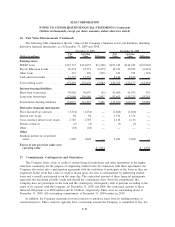
The following table summarizes the restructuring liability balance, which is included in other liabilities in
the accompanying consolidated balance sheet.
Severance
Costs
Lease and
Other
Contract
Termination
Costs
Exit and
Other Costs Total
Balance at December 31, 2007 ............. $18,329 $ — $ — $ 18,329
Net accruals from continuing operations ....... 62,599 9,517 11,400 83,516
Net accruals from discontinued operations ...... 259 — — 259
Cash paid . . . ........................... (66,063) (6,719) (11,340) (84,122)
Balance at December 31, 2008 ............. 15,124 2,798 60 17,982
Net accruals from continuing operations ....... 11,196 890 1,681 13,767
Net accruals from discontinued operations ...... 6,562 1,900 — 8,462
Cash paid . . . ........................... (23,687) (1,807) (1,741) (27,235)
Balance at December 31, 2009 ............. $ 9,195 $ 3,781 $ — $ 12,976
F-79
SLM CORPORATION
NOTES TO CONSOLIDATED FINANCIAL STATEMENTS (Continued)
(Dollars in thousands, except per share amounts, unless otherwise stated)