Sallie Mae 2009 Annual Report Download - page 192
Download and view the complete annual report
Please find page 192 of the 2009 Sallie Mae annual report below. You can navigate through the pages in the report by either clicking on the pages listed below, or by using the keyword search tool below to find specific information within the annual report.-
 1
1 -
2
-
3
-
4
-
5
-
6
-
7
-
8
-
9
-
10
-
11
-
12
-
13
-
14
-
15
-
16
-
17
-
18
-
19
-
20
-
21
-
22
-
23
-
24
-
25
-
26
-
27
-
28
-
29
-
30
-
31
-
32
-
33
-
34
-
35
-
36
-
37
-
38
-
39
-
40
-
41
-
42
-
43
-
44
-
45
-
46
-
47
-
48
-
49
-
50
-
51
-
52
-
53
-
54
-
55
-
56
-
57
-
58
-
59
-
60
-
61
-
62
-
63
-
64
-
65
-
66
-
67
-
68
-
69
-
70
-
71
-
72
-
73
-
74
-
75
-
76
-
77
-
78
-
79
-
80
-
81
-
82
-
83
-
84
-
85
-
86
-
87
-
88
-
89
-
90
-
91
-
92
-
93
-
94
-
95
-
96
-
97
-
98
-
99
-
100
-
101
-
102
-
103
-
104
-
105
-
106
-
107
-
108
-
109
-
110
-
111
-
112
-
113
-
114
-
115
-
116
-
117
-
118
-
119
-
120
-
121
-
122
-
123
-
124
-
125
-
126
-
127
-
128
-
129
-
130
-
131
-
132
-
133
-
134
-
135
-
136
-
137
-
138
-
139
-
140
-
141
-
142
-
143
-
144
-
145
-
146
-
147
-
148
-
149
-
150
-
151
-
152
-
153
-
154
-
155
-
156
-
157
-
158
-
159
-
160
-
161
-
162
-
163
-
164
-
165
-
166
-
167
-
168
-
169
-
170
-
171
-
172
-
173
-
174
-
175
-
176
-
177
-
178
-
179
-
180
-
181
-
 182
182 -
 183
183 -
 184
184 -
 185
185 -
 186
186 -
 187
187 -
 188
188 -
 189
189 -
 190
190 -
 191
191 -
 192
192 -
 193
193 -
 194
194 -
 195
195 -
 196
196 -
 197
197 -
 198
198 -
 199
199 -
 200
200 -
 201
201 -
 202
202 -
203
-
204
-
205
-
206
-
207
-
208
-
209
-
210
-
211
-
212
-
213
-
214
-
215
-
216
-
217
-
218
-
219
-
220
-
221
-
222
-
223
-
224
-
225
-
226
-
227
-
228
-
229
-
230
-
231
-
232
-
233
-
234
-
235
-
236
-
237
-
238
-
239
-
240
-
241
-
242
-
243
-
244
-
245
-
246
-
247
-
248
-
249
-
250
-
251
-
252
-
253
-
254
-
255
-
256
 |
 |

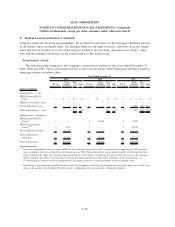
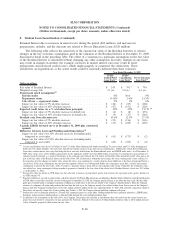
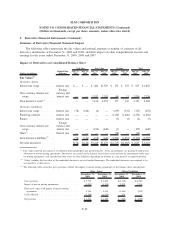
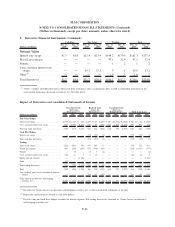
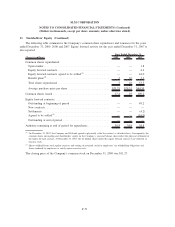
9. Derivative Financial Instruments (Continued)
Summary of Derivative Financial Statement Impact
The following tables summarize the fair values and notional amounts or number of contracts of all
derivative instruments at December 31, 2009 and 2008, and their impact on other comprehensive income and
earnings for the years ended December 31, 2009, 2008 and 2007.
Impact of Derivatives on Consolidated Balance Sheet
(Dollars in millions)
Hedged Risk
Exposure
Dec. 31,
2009
Dec. 31,
2008
Dec. 31,
2009
Dec. 31,
2008
Dec. 31,
2009
Dec. 31,
2008
Dec. 31,
2009
Dec. 31,
2008
Cash Flow Fair Value Trading Total
Fair Values
(1)
Derivative Assets
Interest rate swaps . . . . . . . . . Interest rate $ — $ — $ 684 $1,529 $ 133 $ 323 $ 817 $ 1,852
Cross currency interest rate
swaps.................
Foreign
currency and
interest rate — — 2,932 2,743 44 13 2,976 2,756
Total derivative assets
(3)
. . . . . . — — 3,616 4,272 177 336 3,793 4,608
Derivative Liabilities
Interest rate swaps . . . . . . . . . Interest rate (78) (146) (6) — (639) (332) (723) (478)
Floor/Cap contracts . . . . . . . . . Interest rate — — — — (1,234) (1,466) (1,234) (1,466)
Futures . . . . . . . . . . . . . . . . . Interest rate — — — — (2) (3) (2) (3)
Cross currency interest rate
swaps.................
Foreign
currency and
interest rate — — (192) (640) (1) — (193) (640)
Other
(2)
. . . . . . . . . . . . . . . . . Interest rate — — — — (18) — (18) —
Total derivative liabilities
(3)
. . . (78) (146) (198) (640) (1,894) (1,801) (2,170) (2,587)
Net total derivatives . . . . . . . . $(78) $(146) $3,418 $3,632 $(1,717) $(1,465) $ 1,623 $ 2,021
(1)
Fair values reported are exclusive of collateral held and pledged and accrued interest. Assets and liabilities are presented without con-
sideration of master netting agreements. Derivatives are carried on the balance sheet based on net position by counterparty under mas-
ter netting agreements, and classified in other assets or other liabilities depending on whether in a net positive or negative position.
(2)
“Other” includes the fair value of the embedded derivatives in asset-backed financings. The embedded derivatives are required to be
accounted for as derivatives.
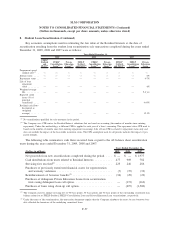
(3)
The following table reconciles gross positions without the impact of master netting agreements to the balance sheet classification:
December 31,
2009
December 31,
2008
December 31,
2009
December 31,
2008
Other Assets Other Liabilities
Gross position. . ........................... $3,793 $ 4,608 $(2,170) $(2,587)
Impact of master netting agreements . . ............ (1,009) (1,594) 1,009 1,594
Derivative values with impact of master netting
agreements . . ........................... 2,784 3,014 (1,161) (993)
Cash collateral . ........................... (1,268) (1,624) 636 —
Net position . . . ........................... $1,516 $ 1,390 $ (525) $ (993)
F-65
SLM CORPORATION
NOTES TO CONSOLIDATED FINANCIAL STATEMENTS (Continued)
(Dollars in thousands, except per share amounts, unless otherwise stated)